Curated OER
Graphing Applications
In this graphing applications worksheet, students derive equations for 4 word problems. Students then define variables, find intercepts, graph the equations, and interpret the slopes.
Curated OER
Logistic Growth
Through the exploration of population growth of a bacteria population, high schoolers learn about and observe bacteria population over a 20 hour period. Students graph the population growth using a scatter plot and discuss its...
Curated OER
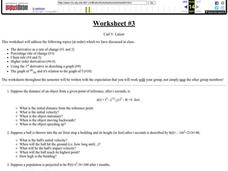
Worksheet #3, Derivative Rates, Percent Rate of Change, Chain Rule
In this calculus worksheet, students answer compute the distance of an object from a given point after t seconds when given the formula. They use the chain rule to answer 2 questions. Students compute the derivatives and sketch a graph...
Curated OER
Trig Derivatives
For this trigonometric derivative worksheet, young scholars analyze the function and identify the derivative. This one-page worksheet contains approximately 20 problems.
Curated OER
Definition Of The Derivative
Students engage in a lesson that is concerned with the concept of a derivative. They define the concept of a derivative and then complete an assignment that is included in the lesson. Students then graph the derivative and draw its...
EngageNY
Multi-Step Problems in the Real World
Connect graphs, equations, and tables for real-world problems. Young mathematicians analyze relationships to identify independent and dependent variables. These identifications help create tables and graphs for each situation.
EngageNY
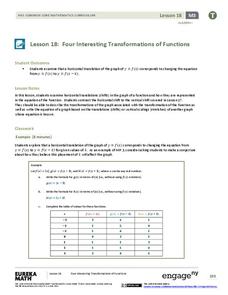
Four Interesting Transformations of Functions (Part 1)
Understanding how functions transform is a key concept in mathematics. This introductory instructional activity makes a strong connection between the function, table, and graph when exploring transformations. While the resource uses...
CK-12 Foundation
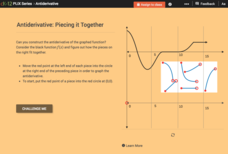
Antiderivative: Piecing it Together
Build a function backwards. Given a graph of the derivative of a function, pupils piece together a graph of the original function, the antiderivative. Learners use their graphs and the graphs of the derivatives to answer questions about...
EngageNY
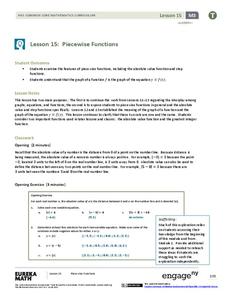
Piecewise Functions
Show your class members that if they can graph a linear function, they can graph an absolute value function. Groups create an absolute value graph using a table, then entertain the idea of an absolute value function defined as two...
EngageNY
Four Interesting Transformations of Functions (Part 2)
What happens to a function whose graph is translated horizontally? Groups find out as they investigate the effects of addition and subtraction within a function. This nineteenth instructional activity in a 26-part series focuses on...
Virginia Department of Education
Circles in the Coordinate Plane
Make the connection between the distance formula and the equation of a circle. The teacher presents a lesson on how to use the distance formula to derive the equation of the circle. Pupils transform circles on the coordinate plane and...
EngageNY
Modeling a Context from Data (part 2)
Forgive me, I regress. Building upon previous modeling activities, the class examines models using the regression function on a graphing calculator. They use the modeling process to interpret the context and to make predictions...
EngageNY
Comparing Rational Expressions
Introduce a new type of function through discovery. Math learners build an understanding of rational expressions by creating tables and graphing the result.
EngageNY
Solution Sets to Equations with Two Variables
Can an equation have an infinite number of solutions? Allow your class to discover the relationship between the input and output variables in a two-variable equation. Class members explore the concept through tables and graphs and...
Houston Area Calculus Teachers
Cubic Polynomial
Birthdays are a time for celebration, and now they're a time for calculation! An AP calculus lesson uniquely explores relationships between a polynomial function and its derivative. Learners create a cubic function based...
EngageNY
Polynomial, Rational, and Radical Relationships
This assessment pair goes way beyond simple graphing, factoring and solving polynomial equations, really forcing learners to investigate the math ideas behind the calculations. Short and to-the-point questions build on one another,...
EngageNY
Obstacles Resolved—A Surprising Result
The greater the degree, the more solutions to find! Individuals find the real solutions from a graph and use the Fundamental Theorem of Algebra to find the remaining factors.
EngageNY
Solution Sets for Equations and Inequalities
How many ways can you represent solutions to an equation? Guide your class through the process of solving equations and representing solutions. Solutions are described in words, as a solution set, and graphed on a number line....
Curated OER
A Day at the Beach
Help learners determine the rate of change for the temperature of sand. They will collect data on the temperature of wet and dry sand over time with a heat lamp overhead. Then make a scatter plot of the data and find a linear model to...
Willow Tree
Slope
Investigate the different types of slope using graphs and ordered pairs. Scholars use the slope formula to determine the slope of a line between two points. Includes examples with a slope of zero and with no slope. The lesson follows a...
Flipped Math
Calculus AB/BC - Extreme Value Theorem, Global Versus Local Extrema, and Critical Points
It is critical to find all the extreme points. Pupils analyze graphs in the presentation to determine whether there are points that are either maximums and minimums. Using derivatives, learners find out how to find critical points from...
Flipped Math
Calculus AB/BC - Determining Intervals on Which a Function is Increasing or Decreasing
Going up? Wait, it might be going down! Learners watch a video to see how to use the derivative and critical points to find where a function is either increasing or decreasing. Individuals use the rate of change to solve real-world...
Flipped Math
Calculus AB/BC Mid-Unit 5 Review: Analytical Applications of Differentiation
It's time to put analytical applications to work. Learners use the eight questions of the mid-Unit 5 review to refresh their memories of the key points. Pupils apply what they have learned to use the Mean Value Theorem, find extrema...
Alabama Department of Archives and History
A Worse Death: War or Flu?
In a lesson plan that integrates history and mathematics, class members create graphs that compare military death statistics from World War I with those that resulted from the influenza pandemic of 1918.


