Concord Consortium
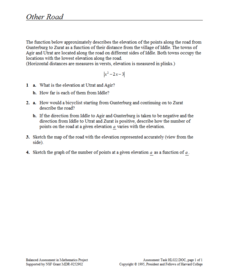
Other Road
Take the road to a greater knowledge of functions. Young mathematicians graph an absolute value function representing a road connecting several towns. Given a description, they identify the locations of the towns on the graph.
CCSS Math Activities
Smarter Balanced Sample Items: High School Math – Target M
Your knowledge of graphs is a function of how much you try. Young mathematicians work on a set of 12 questions that covers graphing functions, comparing functions, and rewriting functions in different forms to determine key features....
Concord Consortium
Rational and Not So Rational Functions
Do not cross the line while graphing. Provided with several coordinate axes along with asymptotes, pupils determine two functions that will fit the given restrictions. Scholars then determine other geometrical relationships of asymptotes...
Curated OER
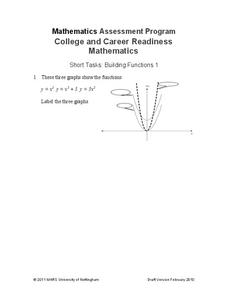
Building Functions
Pupils determine equations that match the graphs of transformations and the parent quadratic function. The resource requires class members to attend to precision and think abstractly.
Balanced Assessment
Movie Survey
Movie preferences will get your classes talking! Individuals read a pie graph and construct a bar graph using the same information. They then answer questions specific to the data and sample size.
EngageNY
Constant Rate
Two-variable equations can express a constant rate situation. The instructional activity presents several constant rate problems. Pupils use the stated constant rate to create a linear equation, find values in a table, and graph the...
Curated OER
Buying Coffee
Starbucks or house blend? Pupils analyze the unit rate as the cost per pound of coffee. They use a graph to visualize the unit rate given the cost for a quantity other than one pound.
Mathematics Assessment Project
Bike Ride
As a middle school assessment task, learners interpret the graph of distance versus time for a bike ride. Pupils then determine distance of the trip, length of the trip, and speeds.
Balanced Assessment
Postcards from the Falls
Pupils use graphs to analyze two pricing schemes for postcards. After determining which is the best deal, individuals determine what is wrong with the other pricing structures and explain their thinking.
Illustrative Mathematics
Puppy Weights
Nobody can say no to puppies, so lets use them in math! Your learners will take puppy birth weights and organize them into different graphs. They can do a variety of different graphs and detail into the problem based on your classroom...
Curated OER
Classroom Supplies
Challenge young mathematicians to buy classroom supplies by staying within the means of a $1,000 budget. The mathematical activity provides learners with the opportunity to decide what items from the supply list would benefit a class of...
Illustrative Mathematics
Graphs of Quadratic Functions
Instead of the typical quadratic questioning, explore the function and look at the three different ways a parabola can be written. The main task is when given several clues, young mathematicians must write an equation that matches the...
Illustrative Mathematics
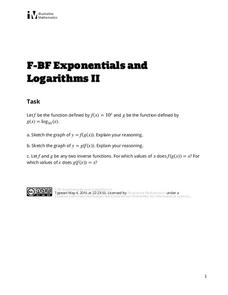
Exponentials and Logarithms II
A simple question sometimes is the best for discussion. High schoolers compare a logarithmic and exponential function and composite them into one another. They graph and compare the difference between the domains. The solution contains...
Mathed Up!
Solving Simultaneous Equations Graphically
The solution resides at the intersection. Pupils use a short instructional activity to review the process of solving a system of linear equations using graphing. The instructional activity provides completed graphs for most of the items,...
Mathematics Assessment Project
Temperatures
As a middle school assessment task, learners first examine line graphs of monthly temperatures for two locations, and then match box plots to each line plot.
EngageNY
Waves, Sinusoids, and Identities
What is the net effect when two waves interfere with each other? The lesson plan answers this question by helping the class visualize waves through graphing. Pupils graph individual waves and determine the effect of the interference...
Illustrative Mathematics
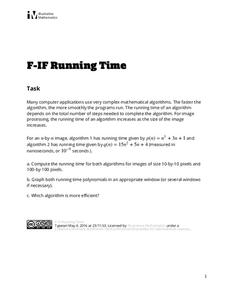
Running Time
Ever wonder why that computer image takes so long to load? Well, math is involved and provides the algorithms needed to compute the measure in nanoseconds. Young mathematicians plug the image measures into the formulas and compare the...
Concord Consortium
Graphical Depictions
Parent functions and their combinations create unique graphical designs. Learners explore these relationships with a progressive approach. Beginning with linear equations and inequalities and progressing to more complex functions,...
Balanced Assessment
Telephone Service
Class members must determine the best phone plan for customers. by assessing three different phone plans. Each plan price depends not only the number of minutes, but also the location of the calls — bringing in a third variable. Scholars...
Concord Consortium
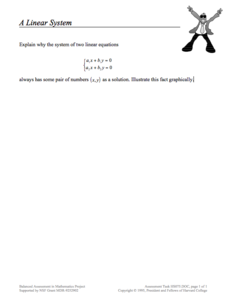
A Linear System
Young mathematicians have the hang of graphing with integer coefficients now. Can they generalize what they've learned to equations with variable coefficients? The task asks individuals to verify the solution to the system is (x,y) and...
Concord Consortium
The Line and the Ellipse
What do a line and an ellipse have in common? Maybe zero, one, or two points! Learners consider the equation of an ellipse and a line to determine if their graphs have any shared points. They then write a system of equations, including...
Illustrative Mathematics
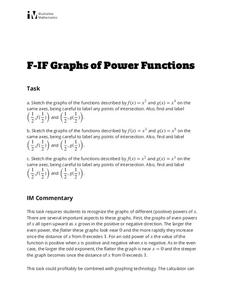
Graphs of Power Functions
This activity consists of three exercises in which learners sketch the graphs of various power functions on the same axes. They use their sketches to make comparisons and observations which lead to generalizations about the graphs of...
Illustrative Mathematics
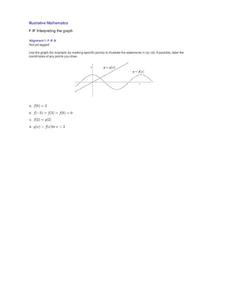
Interpreting the graph
The purpose of this exercise is to give practice in reading information about a function from its graph. Learners are given graphs of two functions on the same axes. The task is to locate and label various key points on the graph that...
Mt. San Antonio Collage
Test 2: Rationals, Exponentials, and Logarithms
Running out of logarithm questions in class? The nicely organized two-page worksheet provides practice in rational, logarithmic, and exponential functions. All the topics include graphing, solving, and finding domain and range.
Other popular searches
- Coordinate Graphing Pictures
- Graphing Ordered Pairs
- Graphing Skills Lesson Plans
- Coordinate Graphing
- Graphing Linear Equations
- Holiday Coordinate Graphing
- Graphing Linear Inequalities
- Graphing Calculator
- Graphing Inequalities
- Halloween Math Graphing
- Graphing Mean, Median, Mode
- Graphing Data


