PBS
Math with Jake: Frequencies and Pitch
Be an octave above the rest. A musician explains how to write music in different time signatures. An interesting resource continues to demonstrate ratios using the pitch of musical notes and hertz. Pupils use a pitch table and determine...
Mathed Up!
Tallys and Charts
After watching a brief instructional video, young mathematicians are put to the test. By completing and reading frequency tables, tally charts, and bar graphs, individuals show their understanding of how to interpret data.
Curated OER
State Names: Frequency
Data grathers determine the frequency of specified data. They identify the frequency that specified letters occur in the names of all 50 states. They create stem-and-leaf plots, box-and-whisket plots and historgrams to illustrate the data.
Concord Consortium
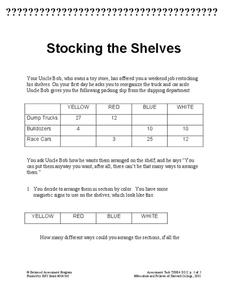
Stocking the Shelves
How many ways can you stock a shelf? It's probably more than you think! Young scholars use data in a frequency table to determine how many ways to stock a shelf given a specific constraint for types of groups. They then repeat the task...
Charleston School District
Pre-Test Unit 9: Scatter Plots
What do your classes know about statistics? Use a pre-test to determine their background. Topics include scatter plots and lines of best fit, two-way frequency tables, and modeling with linear equations.
Curated OER
Data Collection and Presentation
Middle and high schoolers collect and analyze data from four different activities. The activities include information about classmates, tallying colors of cars in a parking lot, stem and leaf plots, and making a histogram from winning...
NASA
What's the Frequency, Roy G. Biv?
While all light travels at the same speed, each color in the visible light spectrum contains a different wavelength and frequency. Scholars determine the relationship between frequency and wavelength as they complete the activity. They...
Curated OER
Quantitative Data
In this quantitative data worksheet, pupils compute measures of central tendency, draw vertical line diagrams, and compare collected data. This 23-page worksheet contains approximately 100 multi-step problems. Explanations and examples...
West Contra Costa Unified School District
Introduction to Conditional Probability
Here is a turnkey lesson that walks young statisticians through the development and uses of conditional probability. From dice games to surveys, Venn diagrams to frequency tables, the class learns how a given can effect the overall...
Howard Hughes Medical Institute
Spreadsheet Tutorial 5: Histogram
A professional-looking histogram is just a few clicks away. The last installment of a five-part Spreadsheet Data Analysis series focuses on histograms. Learners work through a tutorial to see how spreadsheets can help make frequency...
Mathematics Assessment Project
Statistics and Probability
Quickly assess basic understandings of statistics and probability. The resource contains five quick tasks from the probability and statistics domain. The questions range from finding simple conditional probabilities to measures of center...
Mathed Up!
Probability and Relative Frequency
Go ahead and take a chance. Given the probability of an event, scholars determine the frequency of the event out of a sample. The part of a review series for the General Certificate of Secondary Education math assessment asks classmates...
Curated OER
Handling Data: Collecting and Recording Data
Students collect and record data. For this collecting and recording data lesson, students collect data and record that data using frequency tables which include the x and y axis.
Curated OER
Bar Graphs
Seventh graders visually represent and analyze data using a frequency table. They recognize what values in a data set are bigger by looking at a bar graph and answer questions about certain bar graphs and what they represent. Students...
Curated OER
Favourite Colours
In this colors worksheet, learners survey 20 people on what their favorite color is. They mark the results using tallies. Students then take their data and put the totals in a frequency table.
Curated OER
Frequency, Histograms, Bar Graphs and Tables
In this frequency instructional activity, students interpret histograms, bar graphs and tables. They examine frequency charts and comparison line graphs. This three-page instructional activity contains 4 problems. Answers are provided...
Curated OER
Integrated Algebra Practice: Frequency Histograms, Bar Graphs and Tables
In this graphs learning exercise, students solve 4 problems about histograms, bar graphs, and tables. Students answer questions about histograms, bar graphs, and tables.
Curated OER
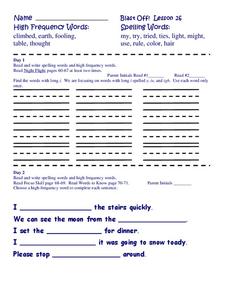
High Frequency Words--Lesson 26
In this high frequency words worksheet, students read and write the thirteen spelling and high frequency words onto the provided lines. Students fill in the correct words to complete each of the five given sentences.
Curated OER
Data Analysis: For Little Learners
Using pictographs, tally charts, and surveys, kids learn all about data analysis and collection. They make surveys, collect data, then construct pictographs and tally charts to organize their information.
Mathematics Vision Project
Module 9: Modeling Data
How many different ways can you model data? Scholars learn several in the final module in a series of nine. Learners model data with dot plots, box plots, histograms, and scatter plots. They also analyze the data based on the data...
Rice University
Introductory Statistics
Statistically speaking, the content covers several grades. Featuring all of the statistics typically covered in a college-level Statistics course, the expansive content spans from sixth grade on up to high school. Material comes from a...
Florida Center for Reading Research
Fluency: Words, I Read, You Point
Learners read as many high-frequency words as possible in a given amount of time. Peer one reads a word from a list, and peer two points to the corresponding word as they are seen on the table. This activity is timed and peer evaluated.
Curated OER
Going Graph-y
Second graders listen to and dicuss the story Where the Wild Things Are. They play a pantomime game and act out various feelings so their classmates can guess. They listen for the frequency of certain words, and record their findings on...
Curated OER
Measures of Center
In this statistics worksheet, students find mean, median, and mode for 3 problems. They find the mean of summarized data in 2 problems.
Other popular searches
- Frequency Tables Line Plots
- Math Frequency Tables
- Making Frequency Tables
- Reading Frequency Tables
- Creating Frequency Tables
- Cumulative Frequency Tables
- Frequency Tables 7th Grade
- Intro to Frequency Tables
- Making Frequency Tables Quiz


