Do2Learn
Desk Chart
Did Sally Student raise her hand to speak? Walk quietly into the room? Share her work with a partner? Great! Reinforce positive behaviors with an individualized chart. Once a learner completes a certain action three times, he or she gets...
Printable Behavior Charts
Goal Chart
Encourage your pupils to set and meet goals by incorporating regular goal setting sessions. They can fill out this chart, which provides space for writing in six goals, dates by which learners would like to achieve these goals, a...
K12 Reader
Narrator’s Point of View Flow Chart
How can you tell what point of view a narrator is using, and why does it matter when reading or writing? Use a handy flow chart to determine whether or not your narrator is telling the story from a first or third person point of view.
Do2Learn
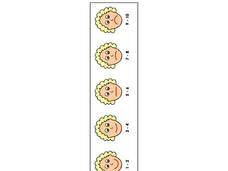
Feelings Chart
Some days are better than others. Help autistic learners and other members of your class who have difficulty expressing their emotions with a feelings chart that presents a smiling face, a less smiling face, a neutral face, an unhappy...
Curated OER
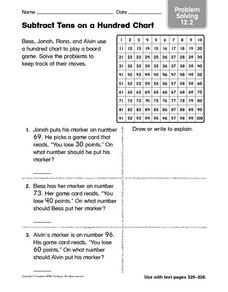
Subtract Tens on a Hundred Chart Problem Solving 12.2
In this hundred chart worksheet, students read three story problems pertaining to the subtraction of tens on a hundred chart. Students solve each problem.
Curated OER
Hundred Chart
In this math instructional activity, students examine a hundred chart. The ten by ten chart includes all numbers one to one-hundred. Students may identify patterns in the chart.
Curated OER
Tally Chart/Pictograph
In this graphic organizer worksheet, students can record their own data on this tally chart/pictograph. There are two columns and six rows with room for a title.
Curated OER
Using a Hundreds Chart
Youngsters participate in three activities using the hundreds chart. They will choose numbers to add up to one hundred. Whoever gets the most combinations wins. Two variations of the game are supplied.
Curated OER
Number Chart 12: Skip Counting by 5
In this skip counting worksheet, students fill in the numbers to complete a pattern of skip counting by 5. Students begin with the number 5 and write the numbers as they skip count to 200.
Curated OER
Number Chart 1-100
In this counting worksheet, students complete a number chart. Students fill in the missing numbers from one through one hundred.
Scholastic
Spin-a-Story: Writing Prompts Chart
"But I don't know what to write about!" Now, there's a very familiar complaint. And here's a very creative solution. Young authors are given a writing prompt chart, spin three wheels that provide suggestions for the who, what, and where...
Curated OER
Verb Conjugation Chart
Give your beginning Spanish speakers practice conjugating different verbs by printing out this chart. It can be used for any four verbs, or you could cut the sheet in four to create a bell-ringer or exit slip activity.
Curated OER
Counting to 100 (by 1s)
This hundreds chart is missing some numbers! Your scholars fill them in (92 are missing), and then they challenge themselves with a chart that looks a bit different. Using the same 10 x 10 layout, the second chart is filled with letters,...
Curated OER
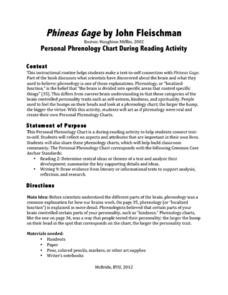
Phineas Gage: Personal Phrenology Chart During Reading Activity
Phrenology, the belief that parts of your brain control certain aspects of your personality, is described in Phineas Gage: A Gruesome but True Story About Brain Science. While we now know much more about the brain, learners use this idea...
Curated OER
Pet Tally
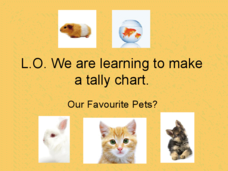
Give the class an opportunity to practice using tally marks as a way to collect data. As you progress through the slide show, learners tally up the number and types of pets they see, they then use their data to create a tally chart....
Curated OER
Wildwood Dancing: K-W-H-L Reading Strategy On Prejudice
As part of a study of Juliet Marillier's Wildwood Dancing, class members create a KWHL chart listing what they know, what the want to know, how they will find information, and what they have learned about prejudice.
Curated OER
Seedfolks Character Chart
There are quite a few characters in Paul Fleischman's Seedfolks, so why not help your class keep track of them? Learners can mark up this chart to show the traits that apply to each character. Along the left, each character is listed,...
Curated OER
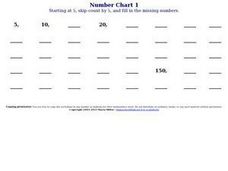
Number Chart 1
In this 100's number chart activity, students fill in the missing numbers that don't appear in the chart. Students have to fill in 44 missing numbers.
Curated OER
Semantic Feature Analysis Chart: The Outsiders
Cool! Do you ned a way to increase vocabulary development and study a story's characters? What a great idea. Use this semantic analysis chart to study new vocabulary and the characters that appear in The Outsiders. You could also use...
Mountain View High School
The Big Religion Chart
This resource includes a list of over 40 world religions and their major features, such as brief summaries of their origins and history, beliefs in god and an afterlife, practices, foundational texts, etc. The document also includes an...
EngageNY
Interpreting and Connecting Information: Creating a Cascading Consequence Chart Using Frightful’s Mountain
Decisions, decisions. Scholars take a close look at making decisions by discussing the character Sam in chapters one through eight of Frightful’s Mountain. Partners discuss whether Sam should interact with Frightful and then complete a...
Curated OER
Character Sketch Chart
What does Candy look like? What kind of a person is Curley? What is Slim's dream? Readers of Of Mice and Men take their turn at characterization by creating a sketch chart for each of the major characters in Steinbeck's classic novel....
EngageNY
Forming a Research-Based Claim: Cascading Consequences Chart
Is it relevant? Scholars choose a resource from their folders and search for relevant information about the harmful and beneficial consequences of DDT. They mark benefits in one color and harmful effects with another color. They then add...
EngageNY
Using Multiple Resources of Information: Creating a Cascading Consequences Chart about DDT and Practicing a Fishbowl Discussion
For every action there is a consequence. Scholars continue their work on creating a cascading consequence chart about DDT using Welcome Back, The Exterminator, Rachel Carson: Sounding the Alarm on Pollution along with graphic organizers...
Other popular searches
- Charts and Graphs
- Multiplication Charts
- Maps and Charts
- Place Value Chart
- Tally Charts
- Pie Charts and Graphs
- Pie Chart
- Kwl Chart
- Multiplication Charts to 100
- Reading Charts and Graphs
- Charts
- Prime Numbers 100's Chart


