EngageNY
Using Linear Models in a Data Context
Practice using linear models to answer a question of interest. The 12th installment of a 16-part module combines many of the skills from previous lessons. It has scholars draw scatter plots and trend lines, develop linear models, and...
Houghton Mifflin Harcourt
Unit 3 Math Vocabulary Cards (Grade 1)
Reinforce math vocabulary with a set of flashcards. Each card showcases a boldly typed word or a picture representation with labels. The topics are geometry related and include terms such as cones, faces, pyramids, sides, and...
EngageNY
Modeling Relationships with a Line
What linear equation will fit this data, and how close is it? Through discussion and partner work, young mathematicians learn the procedure to determine a regression line in order to make predictions from the data.
Houghton Mifflin Harcourt
Unit 3 Math Vocabulary Cards (Grade 5)
Fifty-four flashcards make up a set to help reinforce math vocabulary. The set offers two types of cards; a word card printed in bold font, and a definition card equipped with an example and labels. Terms include capacity,...
American Statistical Association
Scatter It! (Using Census Results to Help Predict Melissa’s Height)
Pupils use the provided census data to guess the future height of a child. They organize and plot the data, solve for the line of best fit, and determine the likely height and range for a specific age.
US Department of Commerce
Diversity: Languages Spoken in the United States
High schoolers begin a discussion on diversity and determine the percent of the population that speak another language at home in the US. Classmates make a prediction of the percentage of people that speak another language at home in...
EngageNY
Modeling with Polynomials—An Introduction (part 2)
Linear, quadratic, and now cubic functions can model real-life patterns. High schoolers create cubic regression equations to model different scenarios. They then use the regression equations to make predictions.
Sea World
Splash of Math
How can kids use math to learn about marine life? Combine math skills with science lessons in a resource featuring activities about life in the sea. Kids graph and calculate data, solve complex word problems, measure geometric shapes,...
August House
The Magic Pot
The Magic Pot by Patricia Coombs is the theme of this multidisciplinary lesson plan. Early readers first take part in a read aloud and grand conversation about the story's details. Then, they get to work practicing their skills in...
Noyce Foundation
Fair Game?
The game should be fair at all costs. The mini-assessment revolves around the ability to use probabilities to determine whether a game is fair. Individuals determine compound events to calculate simple probabilities and make...
EngageNY
Modeling a Context from Data (part 2)
Forgive me, I regress. Building upon previous modeling activities, the class examines models using the regression function on a graphing calculator. They use the modeling process to interpret the context and to make predictions...
Mary Pope Osborne, Classroom Adventures Program
Mummies in the Morning Egyptian pyramids, hieroglyphics
Visit the Magic Treehouse and take your class on a trip through time with a reading of the children's book Mummies in the Morning. Using the story to spark an investigation into Egyptian culture, this literature unit engages...
EngageNY
Mid-Module Assessment Task - Algebra 2 (Module 1)
Challenge classes to think deeply and apply their understanding of polynomials. The assessment prompts learners to use polynomial functions to model different situations and use them to make predictions and conclusions.
EngageNY
Modeling with Quadratic Functions (part 1)
Relevance is key! The resource applies quadratic modeling by incorporating application of physics and business. Pupils work through scenarios of projectile motion and revenue/profit relationships. By using the key features of the graph,...
National Security Agency
It's Probably Probable
Learners make predictions and draw conclusions from given information as they learn the meaning of probability in this vocabulary-rich, integrated activity that presents a variety of teaching strategies to motivate and reach...
Curated OER
Making Regolith
You may not be able to take a field trip to the moon, but that doesn't mean your class can't study moon rocks. Using graham crackers as the moon's bedrock and powdered donuts as micrometeorites, young scientists simulate...
Mathematics Vision Project
Module 3: Arithmetic and Geometric Sequences
Natural human interest in patterns and algebraic study of function notation are linked in this introductory unit on the properties of sequences. Once presented with a pattern or situation, the class works through how to justify...
Kenan Fellows
Applying Linear Regression to Marathon Data
It's not a sprint, it's a marathon! Statistic concepts take time to develop and understand. A guided activity provides an opportunity for individuals to practice their linear regression techniques in spreadsheet software. The activity...
EngageNY
Events and Venn Diagrams
Time for statistics and learning to overlap! Learners examine Venn Diagrams as a means to organize data. They then use the diagrams to calculate simple and compound probabilities.
EngageNY
The Graph of a Linear Equation in Two Variables
Add more points on the graph ... and it still remains a line! The 13th installment in a series of 33 leads the class to the understanding that the graph of linear equation is a line. Pupils find several solutions to a two-variable linear...
Inside Mathematics
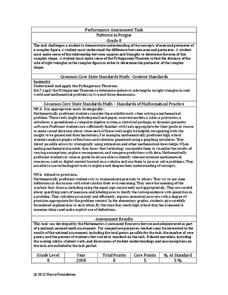
Patterns in Prague
Designers in Prague are not diagonally challenged. The mini-assessment provides a complex pattern made from blocks. Individuals use the pattern to find the area and perimeter of the design. To find the perimeter, they use the Pythagorean...
EngageNY
Tax, Commissions, Fees, and Other Real-World Percent Problems
Pupils work several real-world problems that use percents in the 11th portion of a 20-part series. The problems contain percents involved with taxes, commissions, discounts, tips, fees, and interest. Scholars use the equations formed for...
West Contra Costa Unified School District
Connecting Graphing and Solving Absolute Value Equations and Functions
Can you solve an equation graphically? Absolutely! This Algebra II lesson makes the connection between solving an absolute value equation and graphing two functions. Graphing absolute value functions is presented through the process of...
Inside Mathematics
Rugs
The class braids irrational numbers, Pythagoras, and perimeter together. The mini-assessment requires scholars to use irrational numbers and the Pythagorean Theorem to find perimeters of rugs. The rugs are rectangular, triangular,...


