Concord Consortium
Parameters and Clusters II
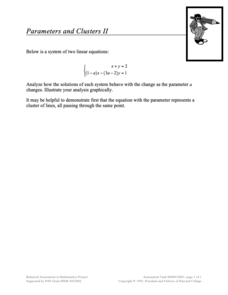
Let's give parameters a second try. Scholars take a second look at a system of linear equations that involve a parameter. Using their knowledge of solutions of systems of linear equations, learners describe the solution to the system as...
Concord Consortium
Parameters and Clusters I
Chase the traveling solution. Pupils analyze the solutions to a system of linear equations as the parameter in one equation changes. Scholars then use graphs to illustrate their analyses.
Chicago Botanic Garden
Climate Change Around the World
Look at climate change around the world using graphical representations and a hands-on learning simulation specified to particular cities around the world. Using an interactive website, young scientists follow the provided...
Illustrative Mathematics
Exploring Sinusoidal Functions
What effect does changing a parameter have on the graph of a trigonometric function? Pupils use a Desmos applet to explore the general sine graph. They experiment changing different parameters and record the resulting change of the...
College Board
2007 AP® Calculus BC Free-Response Questions Form B
There is just a single real-world problem. Released free-response items from the 2007 AP® Calculus BC Form B contains only one real-world question. The question involves rate of change of wind chill scenario. The mathematical problems...
Mathematics Common Core Toolbox
Golf Balls in Water
Here's a resource that models rising water levels with a linear function. The task contains three parts about the level of water in a cylinder in relationship to the number of golf balls placed in it. Class members analyze the data and...
Shodor Education Foundation
Rabbits and Wolves
A change in a parameter can end in overpopulation. The resources gives pupils the opportunity to control the parameters of rabbits and wolves in a natural setting. Using the set parameters, the simulation runs and displays the population...
Concord Consortium
Double Pendulum
What's better than a pendulum for studying motion and periods? A double pendulum! Young physical scientists use an interactive to explore pendulum motion—times two. The resource boasts a host of parameters to change and a running graph...
Shodor Education Foundation
Plop It!
Build upon and stack up data to get the complete picture. Using the applet, pupils build bar graphs. As the bar graph builds, the interactive graphically displays the mean, median, and mode. Learners finish by exploring the changes in...
Shodor Education Foundation
Normal Distribution
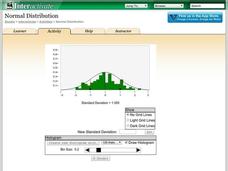
Does the size of the bin matter? The resource allows pupils to explore the relationship between the normal curve and histograms. Learners view histograms compared to a normal curve with a set standard deviation. Using the interactive,...
EngageNY
Curves from Geometry
Escape to investigate hyperbolas. Pupils take a look at what happens to the elliptical orbital path of a satellite that exceeds escape velocity as the opener to the eighth lesson in a unit of 23. Scholars analyze basic hyperbolas and how...
Shodor Education Foundation
Overlapping Gaussians
Adjust the overlap to compare probabilities. Using sliders, learners adjust the shape of two Gaussian curves. The interactive calculates the area of the left tail for one curve and the right tail for the other. Pupils set the interactive...
EngageNY
Transforming Rational Functions
Move all rational functions—well, maybe. Learners investigate the graphs of the reciprocals of power functions to determine a pattern between the graph and the power. Pupils graph rational functions where transformations are clearly...
Mathematics Assessment Project
Modeling Motion: Rolling Cups
Connect the size of a rolling cup to the size of circle it makes. Pupils view videos of cups of different sizes rolling in a circle. Using the videos and additional data, they attempt to determine a relationship between cup...
Mathematics Vision Project
Module 7: Modeling with Functions
The sky's the limit of what you create when combining functions! The module begins with a review of transformations of parent functions and then moves to combining different function types using addition, subtraction, and...
EngageNY
Ferris Wheels—Using Trigonometric Functions to Model Cyclical Behavior
Have class members going in circles as they model the path of a Ferris Wheel using trigonometric functions. Building on the previous lesson in this series on transformations, learners use trigonometric functions to model wheels of...
EngageNY
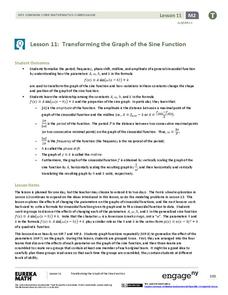
Transforming the Graph of the Sine Function
Build a solid understanding of trigonometric transformations through exploration. Learners work in teams to analyze the effects of different algebraic components on the graph of a sine function.
EngageNY
Comparing Linear and Exponential Models Again
Making connections between a function, table, graph, and context is an essential skill in mathematics. Focused on comparing linear and exponential relationships in all these aspects, this resource equips pupils to recognize and interpret...
Code.org
Image Scroller with Key Events
Discover how to embed images in lists. Scholars modify an existing app to include an image scroller in the 17th lesson of the series. They learn to refactor code and remove redundancies after modifying code.
Teach Engineering
Discovering Relationships Between Side Length and Area
Consider the relationship between side length and area as an input-output function. Scholars create input-output tables for the area of squares to determine an equation in the first installment of a three-part unit. Ditto for the area of...
Shodor Education Foundation
Skew Distribution
Slide the class into a skewed view. Learners alter the location of the median relative to the mean of a normal curve to create a skew distribution. They compare the curve to a histogram distribution with the same skewness.
Texas Education Agency
Texas Gateway: Rational Functions: Predicting the Effects of Parameter Changes
Given parameter changes for rational functions, students will be able to predict the resulting changes on important attributes of the function, including domain and range and asymptotic behavior.
Khan Academy
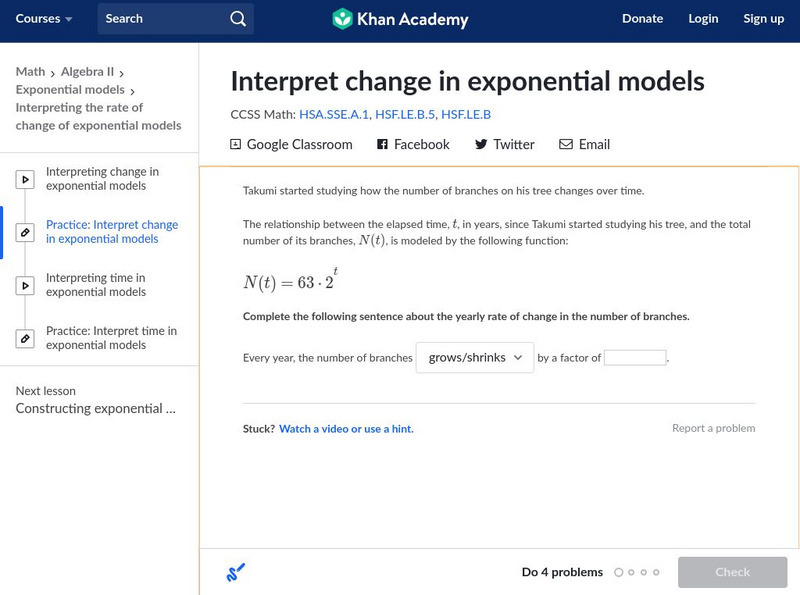
Khan Academy: Interpret Change in Exponential Models
Given a function that models an exponential situation, find the factor by which the quantity changes per unit time interval. Students receive immediate feedback and have the opportunity to try questions repeatedly, watch a video or...
Khan Academy
Khan Academy: Interpret Change in Exponential Models: Changing Units
Given a function that models an exponential situation, rewrite the function in order to find its change for a different time unit. Students receive immediate feedback and have the opportunity to try questions repeatedly, watch a video or...
