Virginia Department of Education
Transformational Graphing
Find relationships between the structure of a function and its graph. An engaging lesson explores seven parent functions and their graphs. Learners match functions to their graphs and describe transformations.
Virginia Department of Education
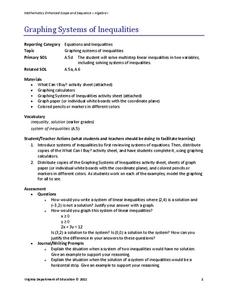
Graphing Systems of Inequalities
Apply systems of inequalities to a real-world problem. Here, scholars learn to graph solutions to systems of linear inequalities. To finish the lesson, they solve a problem involving burgers and cheeseburgers using a system of inequalities.
Balanced Assessment
Cost of Living
Math scholars investigate the cost of living in Hong Kong compared to Chicago but must first convert the different types of currency. They then choose a type of graph to compare different spending categories and finish the activity by...
SHS Algebra
Transformations of Linear and Exponential Graphs
Your transformers will create and analyze graphs to discover which operations produce which transformations. Linear and exponential functions are used to model the transformations.
Pingry School
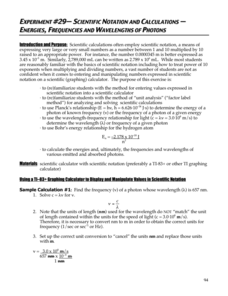
Scientific Notation and Calculations – Energies, Frequencies, and Wavelengths of Photons
The calculator has an interesting way of displaying numbers in scientific notation, but don't let that confuse your pupils! A lesson designed to give learners practice with scientific notation and calculators provides several practice...
Curated OER
Drive the Data Derby
Three days of race car design and driving through the classroom while guessing probability could be a third graders dream. Learn to record car speed, distances traveled, and statistics by using calculation ranges using the mean, median,...
Willow Tree
Line Graphs
Some data just doesn't follow a straight path. Learners use line graphs to represent data that changes over time. They use the graphs to analyze the data and make conclusions.
EngageNY
The Line Joining Two Distinct Points of the Graph y=mx+b Has Slope m
Investigate the relationship between the slope-intercept form and the slope of the graph. The lesson plan leads an investigation of the slope-intercept equation of a line and its slope. Pupils realize the slope is the same as the...
Flipped Math
Unit 5 Review: Systems of Equations
Activate transformers along with algebra systems. Pupils use 10 problems to review transformations of functions to solve a variety of systems of equations. Individuals identify the types of transformations from an equation along with...
National Research Center for Career and Technical Education
Depreciation (Double Declining)
Have you ever been told that your new car begins to lose its value as soon as you drive it off the lot? Aspiring accountants take on the concepts of depreciation and book value through an easy-to-deliver career and technology lesson...
EngageNY
Graphs of Linear Functions and Rate of Change
Discover an important property of linear functions. Learners use the slope formula to calculate the rates of change of linear functions. They find that linear functions have constant rates of change and use this property to determine if...
Flipped Math
Simulations
Simulate an exciting graphing calculator-based lesson. Individuals watch and participate creating simulations using the random number generator in a graphing calculator to answer probability problems. Learners then build simulations to...
Math Worksheets Land
Pie or Circle Graphs—Step-by-Step Lesson
How do you display data that you've collected in a pie chart? Follow a clear step-by-step guide to turning survey results into a visible format. It shows kids how to determine the percentage of the whole that each section represents.
Radford University
Calculating the Cost: Algebraic Planning for a First Car
Scholars decide which job to take based on the pay. They then research cars to potentially purchase and determine the total cost of the car. Finally, they calculate how long they would have to work to purchase the car along with how much...
Concord Consortium
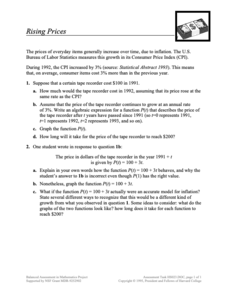
Rising Prices
What will that cost in the future? The scenario provides pupils with a growth as a Consumer Price Index. Learners create functions for a given item to determine future prices and graph them. Class members then compare their functions to...
Concord Consortium
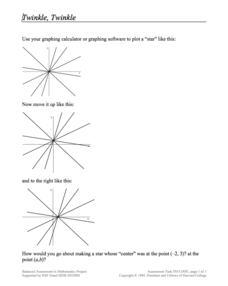
Twinkle, Twinkle
Take a look at a star resource. Young mathematicians use a graphing calculator to draw intersecting lines that look like a star. They then apply translations to move the entire star and also consider what transformations must occur to...
Columbus City Schools
Speed Racers
Who wants to go fast? The answer? Your sixth-grade science superstars! The complete resource offers the ultimate, all-inclusive playbook for mastering the important concepts of speed versus time; distance versus time; and how to graph...
Concord Consortium
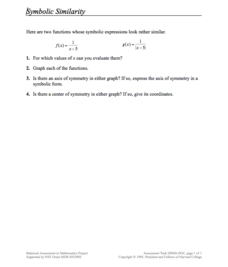
Symbolic Similarity
How many things does one transformation tell you? Learners compare and contrast the graphs of different parent functions with the same transformation. Using a rational and absolute value function, pupils identify key features of their...
Shodor Education Foundation
Conic Flyer
Graphing conics made easy. Individuals use an interactive to graph conic sections. The app can handle circles, vertical and horizontal parabolas, ellipses, and vertical and horizontal hyperbolas.
Concord Consortium
Rational and Not So Rational Functions
Do not cross the line while graphing. Provided with several coordinate axes along with asymptotes, pupils determine two functions that will fit the given restrictions. Scholars then determine other geometrical relationships of asymptotes...
Illustrative Mathematics
Puzzle Times
Give your mathematicians this set of data and have them create a dot plot, then find mean and median. They are asked to question the values of the mean and median and decide why they are not equal. Have learners write their answers or...
Virginia Department of Education
Transformation Investigation
Graph it! Investigate transformations with a graphing calculator. Pupils graph sets of linear functions on the same set of axes. They determine how changes in the equation of a linear function result in changes in the graph.
Mathed Up!
Transformation of Graphs
In what ways can you transform a graph? An engaging video answers this question as it covers reflections, translations, and stretches of graphs. To test their knowledge, individuals complete a set of problems to apply this knowledge.
Concord Consortium
Looking through a Window
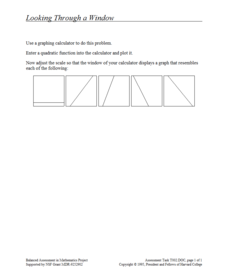
Here's a window into graphing calculators. Scholars use a graphing calculator to plot a quadratic function. They then adjust the window to make the graph look like that of a linear function and must recreate given graphs.
Other popular searches
- Graphing Calculator and Math
- Algebra Graphing Calculators
- Graphing Calculator Math
- Graphing Calculator Skills
- Graphing Calculator Squares
- Graphing Calculator Lessons
- Graphing Calculator Parabola
- Graphing Calculators Ti 83
- Graphing Calculator Activities
- Graphing Calculator Worksheet
- Ti 84 Graphing Calculator


