Willow Tree
Circle Graphs
Pie isn't just for eating! Scholars learn to create pie charts and circle graphs to represent data. Given raw data, learners determine the percent of the whole for each category and then figure out the degree of the circle that percent...
Math Worksheets Land
Pie or Circle Graphs Problems - Independent Practice Worksheet
Third graders take a set of data and turn it into a pie graph with an independent activity. Containing 10 sets of data, the resource reinforced data analysis skills that pupils can use throughout a graphing unit.
Math Worksheets Land
Pie or Circle Graphs - Matching Worksheet
It's one thing to be able to read a pie graph, but it's another to analyze a pie graph and match it to its data table. Use a multiple choice worksheet when challenging learners to practice this skill. With six...
Math Mammoth
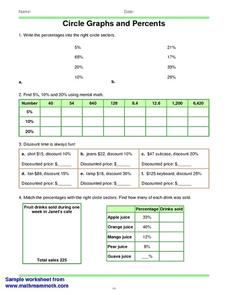
Circles Graphs and Percents
In this percent instructional activity, students read and interpret circle graphs. They determine discounts, and match percentages with circle sectors. This one-page instructional activity contains approximately 30 problems.
Math Worksheets Land
Pie or Circle Graphs—Step-by-Step Lesson
How do you display data that you've collected in a pie chart? Follow a clear step-by-step guide to turning survey results into a visible format. It shows kids how to determine the percentage of the whole that each section represents.
Mt. San Antonio Collage
Graphing Trigonometric Functions
Double win with a comprehensive worksheet and an excellent worked out answer key. The worksheet itself is twelve pages and begins with the simple sine and cosine graphs, then, develops into the reciprocal trig functions.
Willow Tree
Bar Graphs
Circles, lines, dots, boxes: graphs come in all shapes in sizes. Scholars learn how to make a bar graph using univariate data. They also analyze data using those bar graphs.
Virginia Department of Education
Graphs
Examine different types of graphs as a means for analyzing data. Math scholars identify the type of graph from a series of data displays and then develop questions to match each one. Then, given a scatter plot of height versus age...
Virginia Department of Education
Circles in the Coordinate Plane
Make the connection between the distance formula and the equation of a circle. The teacher presents a lesson on how to use the distance formula to derive the equation of the circle. Pupils transform circles on the coordinate plane and...
Inside Mathematics
Squares and Circles
It's all about lines when going around. Pupils graph the relationship between the length of a side of a square and its perimeter. Class members explain the origin in context of the side length and perimeter. They compare the graph to the...
Willow Tree
Line Graphs
Some data just doesn't follow a straight path. Learners use line graphs to represent data that changes over time. They use the graphs to analyze the data and make conclusions.
EngageNY
Writing and Graphing Inequalities in Real-World Problems
Inequalities: when one solution just doesn't suffice. Individuals learn to write inequalities in real-world contexts and graph solution sets on the number line. All inequalities in the lesson are of the form x < c or x < c.
Math Worksheets Land
Reading and Making Pie Graphs Worksheets
The opportunities are endless with a collection of five worksheets that enable young mathematicians to read pie graphs. Individuals use graphs to answer eight multiple choice questions on each sheet. The set of five allows for...
Willow Tree
Histograms and Venn Diagrams
There are many different options for graphing data, which can be overwhelming even for experienced mathematcians. This time, the focus is on histograms and Venn diagrams that highlight the frequency of a range of data and overlap of...
EngageNY
Properties of Trigonometric Functions
Given a value of one trigonometric function, it is easy to determine others. Learners use the periodicity of trigonometric functions to develop properties. After studying the graphs of sine, cosine, and tangent, the lesson connects...
Concord Consortium
Shooting Arrows through a Hoop
The slope makes a difference. Given an equation of a circle and point, scholars determine the relationship of the slope of a line through the point and the number of intersections with the circle. After graphing the relationship, pupils...
Math Moves U
Collecting and Working with Data
Add to your collection of math resources with this extensive series of data analysis worksheets. Whether your teaching how to use frequency tables and tally charts to collect and organize data, or introducing young...
Virginia Department of Education
Nonlinear Systems of Equations
Explore nonlinear systems through graphs and algebra. High schoolers begin by examining the different types of quadratic functions and their possible intersections. They then use algebraic methods to solve systems containing various...
Concord Consortium
Functions by the Slice
Piece by piece ... dismantling a function can highlight interesting patterns. The task asks learners to slice functions in sections with the same vertical change. They then recreate the graph with these slices positioned horizontally....
Curated OER
Expressing Geometric Properties with Equations
Algebra and geometry are not interchangeable. Demonstrate why not with a series of problems that deal with the equations of circles and equations of lines that meet specific criteria.
Concord Consortium
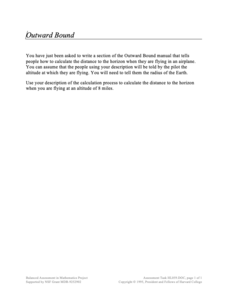
Outward Bound
Just how far can I see? The short assessment question uses the Pythagorean Theorem to find the distance to the horizon from a given altitude. Scholars use the relationship of a tangent segment and the radius of a circle to find the...
CPO Science
Physics Skill and Practice Worksheets
Stop wasting energy searching for physics resources, this comprehensive collection of worksheets has you covered. Starting with introductions to the scientific method, dimensional analysis, and graphing data, these skills practice...
Lane Community College
Review Sheets: Trigonometry
Review guide, practice test, homework packet? Yes, yes, and yes as it's all possible with a wonderful trigonometry packet. Every type of problem is there, starting from the unit circle and ending with conic sections.
Curated OER
Word Problem Practice Workbook
Need worksheets that challenge your middle schoolers to apply their understanding of math? Problem solved! From integers, fractions, and percents, to algebra, geometry, and probability, over 100 pages of word problem worksheets...
Other popular searches
- Percent Circle Graph
- Circle Graph Worksheet
- Circle Graph Template
- Interpreting Circle Graphs
- Circle Graph Protractor
- Circle Graph Activity
- Reading Circle Graphs
- Circle Graphs Pie Charts
- Circle Graph Central Angle
- Bar and Circle Graphs
- Circle Graph in Excel
- Family Budget Circle Graph


