Just Health Action
Environmental Justice Matters: Mapping Cumulative Impacts (Part 2)
A case study enables class members to confirm whether different geographic parts of Seattle, Washington have disproportionate environmental burdens and benefits. Groups use the EPA's Cumulative Health Impact Analysis formula and...
Center Science Education
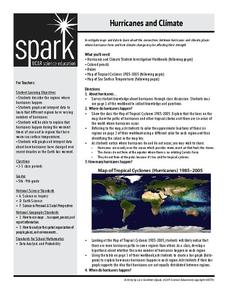
Hurricanes and Climate
Feeling under the weather? This instructional activity on hurricanes can whip things up! With professionally designed maps and handouts, teach your future weathermen (or women) where, when, and how hurricanes occur. They identify...
US Environmental Protection Agency
Mapping Greenhouse Gas Emissions Where You Live
After investigating the US Environmental Protection Agency's climate change website, your environmental studies students discuss greenhouse gas emissions. They use an online interactive tool to look at data from power production...
Montana State University
Who’s on Top?
What's it like to climb Mount Everest? An educational resource encourages an in-depth knowledge of Mount Everest's scientific missions through a variety of activities, including an analysis of maps, a KWL chart, videos, a simulation, and...
Global Oneness Project
A Collapsing City Skyline
Have your high schoolers learn about the modern history of Myanmar by close-reading an article about the city and people of the city Yangon. As they'll learn, the country is going through some dramatic transitions. After...
California Academy of Science
Optimal and Sustainable: Renewable Energy Revamp
More than 100 cities around the world have shifted from fossil fuels to renewable energy sources. Scholars investigate a city wanting to make this switch, but needs help determining how to make the shift. Groups consider all options,...
Center Science Education
Tracking Hurricane News
Here is a unique twist for your lesson on hurricanes. After examining extreme weather news headlines, your storm chasers view a PowerPoint about hurricanes and then zoom in on Hurricane Irene. They map a timeline of her trek up the East...
Chicago Botanic Garden
Plant Phenology Data Analysis
Scientists monitor seasonal changes in plants to better understand their responses to climate change, in turn allowing them to make predictions regarding the future. The last activity in the series of six has scholars analyze BudBurst...
Polar Trec
Where in the World Is Our Teacher?
Kirk Beckendorf, a middle school teacher, joined researchers at the McMurdo Station in Antarctica to help maintain automatic weather stations. The lesson plan encourages pupils to track his travels around the region. They connect with...
Polar Trec
Permafrost Thaw Depth and Ground Cover
The thaw depth of tundra creates a positive feedback loop with both global warming and the carbon cycle. Scholars sort photos and develop a hypothesis for ground cover and permafrost depth. Then they review the data and measurements...
University of Pennsylvania
Decoding Propaganda: J’Accuse…! vs. J’Accuse…!
Reading snail mail is a great way to go back into history and to understand others' points of view. The resource, the second in a five-part unit, covers the Dreyfus Affair. Scholars, working in two different groups, read one letter and...
NOAA
Climate, Corals and Change
Global warming isn't just an issue on land; deep ocean waters are also showing troubling signs. Young scientists learn more about deep water corals and the many recent discoveries researchers have made. Then they examine data related to...
Other popular searches
- Making Maps Geography
- Making Maps and Research
- Making Maps Using Technology
- Making Maps of History
- China, Making Maps
- Making Maps of Community
- Reading Making Maps
- Neigborhoods and Making Maps
- Making Maps Lesson Plans
- Making Maps Usign Technology
- China Making Maps
- Neighborhoods and Making Maps


