Mathed Up!
Drawing Quadratic Graphs
Curve through the points. The resource, created as a review for the General Certificate of Secondary Education Math test, gives scholars the opportunity to refresh their quadratic graphing skills. Pupils fill out function tables to...
Charleston School District
Graphing Functions
How do letters and numbers create a picture? Scholars learn to create input/output tables to graph functions. They graph both linear and nonlinear functions by creating tables and plotting points.
EngageNY
Graphs of Simple Nonlinear Functions
Time to move on to nonlinear functions. Scholars create input/output tables and use these to graph simple nonlinear functions. They calculate rates of change to distinguish between linear and nonlinear functions.
Willow Tree
Graphing
So many methods and so little time! The efficient method of graphing a linear equation depends on what information the problem gives. Pupils learn three different methods of graphing linear equations. They graph equations using...
Virginia Department of Education
Atomic Structure: Periodic Table
The fifth lesson of seven in the series outlines an in-depth analysis of the periodic table. After direct instruction, pupils take turns practicing in the group before beginning independent study. The assessments include a...
Mathed Up!
Straight Line Graphs
Develop graphs by following the pattern. The resource provides opportunities for reviewing graphing linear equations. Pupils create tables to graph linear equations by using patterns whenever possible. The instructional activity and...
Annenberg Foundation
Skeeters Are Overrunning the World
Skeeters are used to model linear and exponential population growth in a wonderfully organized lesson plan including teachers' and students' notes, an assignment, graphs, tables, and equations. Filled with constant deep-reaching...
EngageNY
Graphing Rational Functions
Put everything together in a picture. Scholars take what they learned in the previous three lessons in the 15th segment of a 23-part unit to graph rational functions. They find the end behavior, the horizontal and vertical asymptotes if...
EngageNY
Identifying Proportional and Non-Proportional Relationships in Graphs
Graph a relationship to find out if it is proportional. The instructional activity introduces the criteria for determining whether a relationship is a proportional relationship based on its graph. Pupils graph relationships and determine...
Flipped Math
Modeling with Graphs
Create a graph for anything in the world. Pupils continue to work with graphs that model situations. The learners analyze different graphs to answer questions about the scenario along with finding equations of graphs. Scholars use...
Willow Tree
Circle Graphs
Pie isn't just for eating! Scholars learn to create pie charts and circle graphs to represent data. Given raw data, learners determine the percent of the whole for each category and then figure out the degree of the circle that percent...
West Contra Costa Unified School District
Graph Square Root and Cube Root Functions
Scholars first learn to graph square root and cube root functions by creating a table of values. They then learn how to graph functions from transformation of the graphs of the parent square root and cube root functions.
Willow Tree
Bar Graphs
Circles, lines, dots, boxes: graphs come in all shapes in sizes. Scholars learn how to make a bar graph using univariate data. They also analyze data using those bar graphs.
EngageNY
Relationships Between Quantities and Reasoning with Equations and Their Graphs
Graphing all kinds of situations in one and two variables is the focus of this detailed unit of daily lessons, teaching notes, and assessments. Learners start with piece-wise functions and work their way through setting up and solving...
West Contra Costa Unified School District
Key Features of Graphs
The key is ... After a day of instruction on key features of graphs, groups create a poster and presentation on the key features of their given function graph. The resource provides an extension activity of "telephone" using...
Heidi Songs
Zoo Animal Probability Graph
Capture the engagement of your young mathematicians with a collaborative graphing activity. Using a deck of zoo animal picture cards, students select a picture from the deck, record the chosen animal on a graph,...
EngageNY
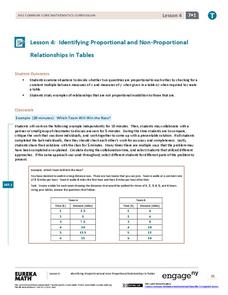
Identifying Proportional and Non-Proportional Relationships in Tables
Learners determine whether there is a constant multiple within the table through an instructional activity that presents a method for determining whether two quantities are proportional. Pupils analyze tables to determine if they...
EngageNY
Identifying Proportional and Non-Proportional Relationships in Tables 2
Not all relationships with a pattern are proportional. Show your class why in the fourth installment of a 22-part series. The lesson builds upon previous parts and has pupils analyze tables to determine whether they represent a...
CK-12 Foundation
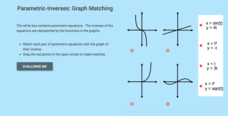
Parametric-Inverses: Graph Matching
Perform a switch to find the inverse of a parametric equation. Pupils match four parametric functions with the graph of the their inverses. Using the graphs, learners determine whether particular points are on the original parametric...
EngageNY
Equations of Graphs of Proportional Relationships Involving Fractions
The 15th segment in a series of 22 uses examples that present proportional relationships with fractions. Pupils work through the problems and discover that the process is the same as it is with whole number values. Graphing the...
Kid Zone
Groundhog's Day Graphing
This Groundhog's Day, challenge scholars to predict, estimate, tally, and graph in a weather-themed lesson in which class members play the role of the groundhog to forecast the weather come February second.
Ontrack Media
Chart of Parent Functions
The characteristics of parent function vary from graph to graph. Let learners decipher the graph, table of values, equations, and any characteristics of those function families to use as a guide. The nicely organized page...
CK-12 Foundation
Evaluate Limits Using Graphs and Tables: Where Is That Limit?
Limits are made easy through graphs and tables. An easy-to-use interactive lets users change a function on a coordinate plane. They relate graphs and tables to the limit at a specific value.
EngageNY
Modeling Linear Relationships
Math modeling is made easy with the first installment of a 16-part module that teaches pupils to model real-world situations as linear relationships. They create graphs, tables of values, and equations given verbal descriptions.


