CK-12 Foundation
Graphs of Absolute Value Equations: Absolute Value Distance
The sole purpose of this interactive is to graph a function representing the distance of a car from a shoe store. Scholars use an interactive to graph such an absolute value function. They then answer a set of challenge questions...
West Contra Costa Unified School District
Connecting Graphing and Solving Absolute Value Equations and Functions
Can you solve an equation graphically? Absolutely! This Algebra II lesson makes the connection between solving an absolute value equation and graphing two functions. Graphing absolute value functions is presented through the process of...
Radford University
Transformational Graphing in the Real World: Air Traffic Control
You're cleared to learn about absolute value functions. An interesting lesson has scholars investigate transformations of the graphs of absolute value functions. They look at air traffic control as an application of the concept.
Curated OER
Parent Functions Review Sheet
No laundry or cooking dinner here: these parent functions are all about math. Every graph you could think of from basic linear functions to the hyperbolic arccotangent function are included. With 40 parent functions, the worksheet...
Flipped Math
Transformations of Functions, Pt. 1
It is transformational! With the beginning lesson on transformations, pupils learn about vertical and horizontal translations. Scholars see how to graph important points to show the translations and then to write the transformed graph in...
Flipped Math
Graphing Functions to Solve Equations
Intersections become solutions. Scholars watch a video on using a graphing calculator to find the solution to an equation in one variable. While watching the presentation, pupils practice working some of the examples and compare their...
Radford University
Function Family Fun
It's time for a family reunion—function families, that is. Pupils first review different types of parent functions. They then see how to apply transformations to graphs and learn how to select the most appropriate type of function to...
West Contra Costa Unified School District
Evaluating Functions Graphically and Algebraically
High schoolers evaluate functions graphically and algebraically. After completing that step, they write a statement describing the input and output.
Flipped Math
Calculus AB/BC - Connecting Multiple Representations of Limits
It's time to put it all together. Viewers of an informative video learn to connect multiple representations of limits. Given algebraic, tabular, and graphical representations of a linear piecewise function, they determine whether a limit...
K20 LEARN
Family Ties: Exploring Families OF Functions
They say it runs in the family. Small groups use a card sorting activity to group graphs of functions into families. After grouping by families, the class develops conclusions for parent functions and create a graphic organizer.
University of North Texas
Library of Functions
Join the family picnic and see how all the functions come together in a PowerPoint that highlights their main features. As it includes topics such as domain, range, and intercepts, the slides are a great guide to promote class...
Flipped Math
Calculus AB/BC - Using the Candidates Test to Determine Absolute (Global) Extrema
Absolutely! Find the global maximum and minimums. Pupils watch a video showing how to find the absolute maximums and minimums of a function on an interval by testing critical points. The learners see how to determine whether a critical...
Rice University
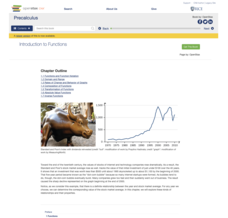
Precalculus
Take a step beyond Algebra 2. Learners use the eBook to learn concepts from the typical Precalculus course. Content starts off with a short review of functions in general and moves on to the basic functions, finishing up with more...
EngageNY
Analyzing a Graph
Collaborative groups utilize their knowledge of parent functions and transformations to determine the equations associated with graphs. The graph is then related to the scenario it represents.
Virginia Tech
Unit Plan: Exponential and Logarithmic Functions
A six-day unit for algebra II on exponential and logarithmic functions builds upon Chapter 12 of Merrill Algebra II with Trigonometry; Applications and Connections. The text provides assistance in the depth of instruction...
EngageNY
Modeling a Context from a Graph
Collaborative pairs develop functions that model a graph from a context using the modeling cycle. They then analyze their function models in order to answer questions about the scenario.
CK-12 Foundation
Vertical Line Test: Exploration
What do vertical lines have to do with functions? Individuals slide a vertical line through four different graphs. They use that vertical line test to determine if the graphs represent functions.
Rice University
Algebra and Trigonometry
Move on into trigonometry. An informative eBook takes the content of a College Algebra course and adds more relating to trigonometry and trigonometric functions. The content organization allows pupils to build upon their learning by...
Illustrative Mathematics
Graphs of Compositions
It might help when working with this resource to give an example of a composition function. For example, the amount of time it takes to get to work depends on the amount of traffic; the amount traffic depends on the time of day....
West Contra Costa Unified School District
The Extreme Value Theorem
Finding the critical numbers of a function can be extreme. The lesson introduces the Extreme Value Theorem to the class with a graph. Pupils then have an opportunity to practice determining the values using an algebraic function.
Rice University
College Algebra
Is there more to college algebra than this? Even though the eBook is designed for a college algebra course, there are several topics that align to Algebra II or Pre-calculus courses. Topics begin with linear equation and inequalities,...
Virginia Department of Education
Give or Take a Few
Young mathematicians extend their knowledge of rational numbers on a number line to graph inequalities by first using number cards to compare rational numbers. They finish by using similar reasoning to graph inequalities on a number line.
Curated OER
Calculate the Slope of a Line Using Two Points
Find that slope! This video does an excellent job of demonstrating how to use the slope formula to find the slope of a line using two points. The instructor first reviews the definition of slope of a line, then works three problems using...


