EngageNY
Analyzing Residuals (Part 1)
Just how far off is the least squares line? Using a graphing calculator, individuals or pairs create residual plots in order to determine how well a best fit line models data. Three examples walk through the calculator procedure of...
Achieve
Ivy Smith Grows Up
Babies grow at an incredible rate! Demonstrate how to model growth using a linear function. Learners build the function from two data points, and then use the function to make predictions.
Curated OER
In the Billions and Linear Modeling
Your learners analyze population data to discern if it best fits a linear scenario. The idea of change by equal differences over equal intervals is enforced in this real-life task.
West Contra Costa Unified School District
Writing Exponential Functions Based on Data
Give your class a concrete example of exponential growth and decay using this hands-on activity. These Algebra II lessons allow for the exploration of exponential growth and decay models, as well as the discovery of the patterns of each....
West Contra Costa Unified School District
Factoring Quadratic Expressions
Factor in different strategies in a lesson plan for factoring quadratics. Young mathematicians first create tables and area models to factor quadratic trinomials into two binomials by guess and check. Learners then investigate how they...
Virginia Department of Education
Quadratic Modeling
Use a one-stop resource for everything you'd possibly want to teach about quadratic functions and models. Scholars analyze key features of quadratic functions as well as transformations of functions through seven activities....
CK-12 Foundation
Inverse Variation Models: Speedometer for Inverse Variation Models
Model inverse variation while solving a real-world problem. Young scholars use the interactive lesson to discover the pattern of inverse variation data. They then use that discovery to write and analyze an equation.
Blogger
Frayer Model
When learning new vocabulary, it is helpful for many learners to have a graphic organizer. With the Frayer model, the vocabulary word is placed in the center, then surrounded by a definition, facts or a description, examples, and...
CK-12 Foundation
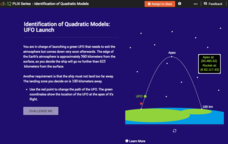
Identification of Quadratic Models: UFO Launch
Build conceptual understanding of graphs of quadratic functions with an out-of-this-world resource. An interactive lesson allows learners to manipulate a graph that models the launch of a UFO. The lesson focuses on the key features of...
Mathematics Vision Project
Module 6: Modeling Periodic Behavior
Around and around we go ... again, and again, and again, and again! That's the nature of a periodic function. Young scholars learn how to model a periodic pattern with trigonometric functions. The nine-lesson unit explores the connection...
Curated OER
Modeling Equations with Bars
Students model linear equations using bars. In this algebra lesson, students solve two steps linear equations through modeling of division, addition and multiplication. They use manipulative to solve equations.
Curated OER
FOIL method using the area model
In this FOIL method worksheet, learners multiply binomials using the FOIL method and the area model. Students find the area of rectangles to investigate why the FOIL method works. Worked examples are provided.
Curated OER
What's Your Shoe Size? Linear Regression with MS Excel
Learners collect and analyze data. In this statistics lesson, pupils create a liner model of their data and analyze it using central tendencies. They find the linear regression using a spreadsheet.
Curated OER
Is there Treasure in Trash?
More people, more garbage! Young environmentalists graph population growth against the amount of garbage generated per year and find a linear model that best fits the data. This is an older resource that could benefit from more recent...
Mathematics Vision Project
Modeling Data
Is there a better way to display data to analyze it? Pupils represent data in a variety of ways using number lines, coordinate graphs, and tables. They determine that certain displays work with different types of data and use two-way...
Mathematics Vision Project
Module 8: Modeling With Functions
Sometimes there just isn't a parent function that fits the situation. Help scholars learn to combine function types through operations and compositions. Learners first explore a new concept with an introductory activity and then follow...
Mathematics Assessment Project
Modeling Motion: Rolling Cups
Connect the size of a rolling cup to the size of circle it makes. Pupils view videos of cups of different sizes rolling in a circle. Using the videos and additional data, they attempt to determine a relationship between cup measurements...
EngageNY
Modeling from a Sequence
Building upon previous knowledge of sequences, collaborative pairs analyze sequences to determine the type and to make predictions of future terms. The exercises build through arithmetic and geometric sequences before introducing...
EngageNY
Modeling with Polynomials—An Introduction (part 1)
Maximizing resources is essential to productivity. Class members complete an activity to show how math can help in the process. Using a piece of construction paper, learners construct a box with the maximum volume. Ultimately, they...
EngageNY
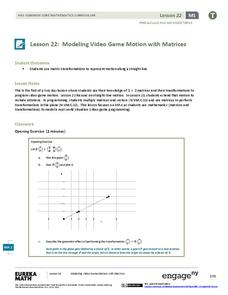
Modeling Video Game Motion with Matrices 1
Video game characters move straight with matrices. The first day of a two-day instructional activity introduces the class to linear transformations that produce straight line motion. The 23rd part in a 32-part series has pupils determine...
EngageNY
Modeling with Quadratic Functions (part 2)
How many points are needed to define a unique parabola? Individuals work with data to answer this question. Ultimately, they determine the quadratic model when given three points. The concept is applied to data from a dropped object,...
EngageNY
More on Modeling Relationships with a Line
How do you create a residual plot? Work as a class and in small groups through the activity in order to learn how to build a residual plot. The activity builds upon previous learning on calculating residuals and serves as a precursor to...
EngageNY
Modeling Relationships with a Line
What linear equation will fit this data, and how close is it? Through discussion and partner work, young mathematicians learn the procedure to determine a regression line in order to make predictions from the data.
National Council of Teachers of Mathematics
Tidal Waves
Periodically ship the class a trigonometric application. Pupils model the level of water in a port. Using their models, learners determine the times that a ship can safely navigate into and out of the port, along with determining other...
Other popular searches
- Dna Models
- Equivalent Fractions Models
- Models of Atoms
- 3d Models
- Multiplication Models
- Scale Models
- Mathematical Models
- Concrete Pictorial Models
- Role Models
- Fraction Models
- Atom Models
- Math Models


