Mathed Up!
Drawing Quadratic Graphs
Curve through the points. The resource, created as a review for the General Certificate of Secondary Education Math test, gives scholars the opportunity to refresh their quadratic graphing skills. Pupils fill out function tables to find...
Curated OER
Graphing and Interpreting Linear Equations in Two Variables
Graph linear equations using a table of values. Learners solve equations in two variables using standard form of an equation. They identify the relationship between x and y values.
Curated OER
Identify and Graph Linear Equations
Students investigate linear functions. In this mathematics lesson, students plot points onto a graph by solving the equations y=x and y=mx+b by being given numbers for x and solving for y.
Illustrative Mathematics
Walk-a-thon 1
Your mathematician's job is to explore the relationship between hours and miles walked during a walk-a-thon. The activity compels your learners to experiment with different means in finding out this proportional relationship. The answer...
Saxon
Plotting Functions
Youngsters use a graphing calculator to assist in creating a function table. They graph the function on a coordinate plane. They explore the relationship between the domain and range in the graph. This four-page worksheet contains two...
Yummy Math
Hot Summer. . . Cold Winter
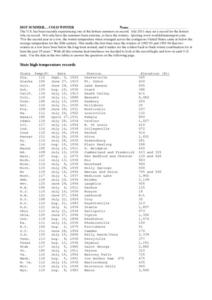
A table of each state's record temperature reports data that middle schoolers can place on a number line for analysis. A written explanation of how to use this tool and the concept of absolute value are also included. Nine questions are...
Illustrative Mathematics
Walk-a-thon 2
During a walk-a-thon your learners must determine the walking rate of Julianna's progress. Using tables, graphs, and an equation, they must be able to calculate the time it took her to walk one mile and predict her distance based on the...
Curated OER
What is the Best Chip?
Scholars collect data about chips. They pick their favorite type of chip from a given variety such as potato chips, tortilla, or banana chips. Then they write on an index card their favorite chip and why it's their favorite. They also...
Illustrative Mathematics
Two-School Dance
Who's ready for the dance? When two middle schools combine for a dance, your learners' job is to calculate the ratio of girls attending. Provided with three different solutions, you can choose from setting up a ratio, linear equation, or...
Charleston School District
Pre-Test Unit 3: Functions
How does an input affect an output? Assess your learners' ability to answer this question using this pre-test. Scholars answer questions about the basics of a function. Topics include determining if a table or statement represents a...
EngageNY
Graphs of Simple Nonlinear Functions
Time to move on to nonlinear functions. Scholars create input/output tables and use these to graph simple nonlinear functions. They calculate rates of change to distinguish between linear and nonlinear functions.
CK-12 Foundation
Values Written as Powers: Binary Numbers 25 to 31
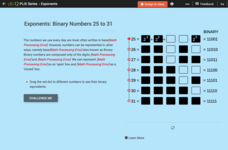
A five-question interactive boosts proficiency in working with binary numbers. Multiple-choice, short answer, and discussion questions challenge mathematicians to write numbers 25 through 31in exponential and binary form. An adjustable...
Willow Tree
Graphing
So many methods and so little time! The efficient method of graphing a linear equation depends on what information the problem gives. Pupils learn three different methods of graphing linear equations. They graph equations using...
Shodor Education Foundation
Function Machine
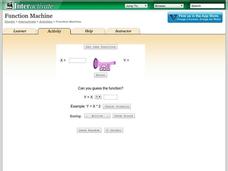
Machines can be so helpful sometimes. A simple interactive has learners enter input values for a function machine and observe output values. These values help determine a function that represents the input-output relationship in the...
5280 Math
Factory Functions
Solve a real-life problem using function-building skills. Presented with an open-ended question, scholars complete a checklist to create and justify a solution in an interesting algebra project. The checklist asks for justifications of...
Mathematics Vision Project
Module 9: Modeling Data
How many different ways can you model data? Scholars learn several in the final module in a series of nine. Learners model data with dot plots, box plots, histograms, and scatter plots. They also analyze the data based on the data...
Virginia Department of Education
A Mystery to Solve
Investigate field properties of real numbers. Scholars use a table for a given operation to determine the identity element. They use the same table to find a missing value in an equation.
Curated OER
Review Graphing Parabolas & Circles
Students review how to graph parabolas. They practice graphing two different parabolas using the vertex and table method. They solve problems related to graphing circles, determining the radius and the center.
Illustrative Mathematics
Rainfall
Ideal for use as an introduction to the idea of inverse functions, this activity investigates rainfall as a function of time. Learners use the data displayed in a table of values to analyze the function and its inverse, including why the...
Mathematics Vision Project
Module 8: Modeling Data
Statistics come front and center in this unit all about analyzing discrete data. Real-world situations yield data sets that the class then uses to tease out connections and conclusions. Beginning with the basic histogram and...
Teach Engineering
Spring Away!
The last segment of the nine-part unit makes a connection between springs and linear equations. Groups hang weights from the spring and measure its length. Then, using the data collected, they calculate the slope to find the k-value of...
Balanced Assessment
Dot Patterns
Use geometric patterns to teach your class how to write functions. The assessment task has scholars consider a pattern of dots to draw the next picture of the pattern. Pupils then analyze the pattern, which helps them develop a function...
Inside Mathematics
Rugs
The class braids irrational numbers, Pythagoras, and perimeter together. The mini-assessment requires scholars to use irrational numbers and the Pythagorean Theorem to find perimeters of rugs. The rugs are rectangular, triangular,...
University of Utah
Integer Exponents, Scientific Notation and Volume
A one-stop resource for exponents, square and cube roots, scientific notation, and volume formulas guides learners through properties of exponents. As they learn to apply these properties to operations with scientific notation,...


