CK-12 Foundation
Geometric Probability: Dartboard
Get your class on target with probability using an exciting resource. The interactive presents three square dartboards with different target areas, which are combinations of square units. Pupils determine the probabilities of randomly...
CK-12 Foundation
Measurement of Probability: Basketball Throw
Future mathematicians use an interactive to see how changing the size of a basketball court and the size of a region in the court affects the probability that a ball will randomly fall within the specified region. No calculations are...
Shodor Education Foundation
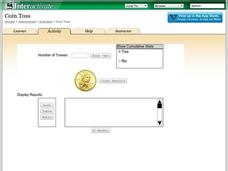
Coin Toss
Are your young mathematicians having a hard time making heads or tails of probabilities? It's no toss up—here is a resource that's sure to straighten them out! Learners run the interactive to toss a coin a different number of times....
PHET
Plinko Probability
It's a good thing the resource dropped into your radar. Young mathematicians use an app that randomly drops balls through a Plinko game and into bins. They compare the distribution to that of an ideal binomial distribution.
Curated OER
Election Poll, Variation 3
Build on probability and incorporate a random number generator to select outcomes for a school election. Your learners will record their results on a dot plot and answer questions regarding whether their candidate has a chance at the...
Teachers.net
Solving Equations Using Variables
Middle-schoolers solve linear equations with one single variable. They solve equations that are randomly generated using index cards. Half of an equation is written on each card and distributed to the class. which then attempts solve...
National Security Agency
Sampling for a Rock Concert
Over the course of three class periods, middle schoolers design an experiment to provide learner input to administration about which rock band to invite to play at school. They practice several random sampling exercises, all well...
Curated OER
Multiplication BINGO
Students receive a multiplication BINGO card. Students are given the answers to the fact cards that may be given during the game. Students arrange these answers in random places on their BINGO board. As each fact card is shown, students...
Curated OER
Election Poll, Variation 2
When a random sample isn't enough, your math class can compare the data from a physical simulation to decide if the probability is still likely. The lesson is part of a probability series that focuses on one question and different ways...
EngageNY
Sampling Variability and the Effect of Sample Size
The 19th installment in a 25-part series builds upon the sampling from the previous unit and takes a larger sample. Pupils compare the dot plots of sample means using two different sample sizes to find which one has the better variability.
Utah Education Network (UEN)
Probability and Statistics
MAD about statistics? In the seventh chapter of an eight-part seventh-grade workbook series, learners develop probability models and use statistics to draw inferences. In addition, learners play games and conduct experiments to determine...
EngageNY
Why Worry About Sampling Variability?
Are the means the same or not? Groups create samples from a bag of numbers and calculate the sample means. Using the sample means as an estimate for the population mean, scholars try to determine whether the difference is real or not.
Education Development Center
Choosing Samples
What makes a good sample? Your classes collaborate to answer this question through a task involving areas of rectangles. Given a set of 100 rectangles, they sample a set of five rectangles to estimate the average area of the figures. The...
Power to Learn.com
Survey of Favorites
Upper grade and middle schoolers discuss their favorite TV programs, music, books, etc. Following a lesson on measures of central tendency, learners discuss random sampling. They conduct a survey and use charts and frequency tables to...
National Security Agency
It's Probably Probable
Learners make predictions and draw conclusions from given information as they learn the meaning of probability in this vocabulary-rich, integrated activity that presents a variety of teaching strategies to motivate and reach all learning...
Curated OER
Heredity Mix 'n Match
Students randomly select jelly beans that represent genes for several human traits such as tongue-rolling ability and eye color. Then, working in pairs (preferably of mixed gender), students randomly choose new pairs of jelly beans from...
Curated OER
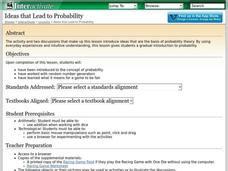
Ideas that Lead to Probability
Students explore the concept of probability. In this probability lesson, students use random number generators to determine probabilities of events. Students discuss if certain probable events are fair. Students determine fair ways to...
Curated OER
Explorations for the Area Probability Applet
Math whizzes use the area probability applet to manipulate the size of the circle and the rectangle to explore the probability that a point in the rectangle is also in the circle.
NOAA
Sustaining Our Ocean Resources
Lead young scientists on an investigation of fishery practices with the final installment of this four-part unit. Using a PowerPoint presentation and hands-on simulation, this lesson engages children in learning how fish populations are...
Curated OER
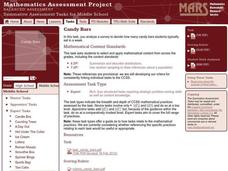
Candy Bars
There is often more to data than meets the eye. Scholars learn that they need to analyze data before making conclusions as they look at data that describes the number of candy bars boys and girls eat. They disprove a given conclusion and...
Bowland
Public Transport
"Statistics is the grammar of science" -Karl Pearson. In the assessment task, learners read a claim made by a newspaper and analyze its conclusions. They need to think about the sample and the wording of the given statistics.
Curated OER
Surveys and Samples
For this surveys and samples worksheet, students discover data collection techniques and write their own survey questions. Students use random sampling, convenience sampling, and systemic sampling and analyze their results.
Curated OER
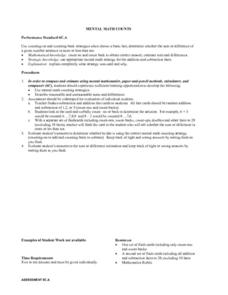
Mental Math Counts
Students use mental math. They describe reasonable and unreasonable sums and differences. Students use mental math to find the sums and differences of addition and subtraction facts at random. They solve addition and subtraction facts...
Curated OER
Exponential Growth
Students study exponential functions. In this exponential growth instructional activity, students conduct a simulation in which a population grows at random but predictable rate. Students compare and contrast linear and exponential...
Other popular searches
- Random Acts of Kindness
- Random Sampling
- Random Numbers
- Random Mutations
- Random Remainders
- Random Number Generators
- Random Sampling Population
- Random Ballots
- Random Samples
- Random Statistics
- Random Search
- Simple Random Sampling


