College Board
2003 AP® Statistics Free-Response Questions
Hypothetically, knowing the structure of a test should help. Pupils use the released free-response questions from the 2003 AP® Statistics exam to become aware of the structure of questions on the test. Half the questions in the set...
College Board
2007 AP® Statistics Free-Response Questions
Knowing the questions ahead of time should be beneficial. Free-response questions released from the 2007 AP® Statistics tests provide teachers and pupils insight into the types of questions on the exam. The six open-ended questions show...
CCSS Math Activities
Smarter Balanced Sample Items: 6th Grade Math – Target J
What is the best measure of central tendency? Scholars explore mean, median, mode, range, and interquartile range to understand the similarities and differences. They display data in dot plots, histograms, box plots, and more as part of...
College Board
2013 AP® Statistics Free-Response Questions
AP® exams don't need to be shrouded in mystery. The 2013 AP® Statistics free-response questions are available for instructors to reference. It includes questions on mean, standard deviation, normal distribution, confidence intervals,...
College Board
Three Calculator Simulation Activities
Calculators sure come in handy. An AP® Statistics instructional resource provides suggestions for using calculator simulations. It gives activities for adding variances, normal probability plots, and t distributions.
College Board
Is That an Assumption or a Condition?
Don't assume your pupils understand assumptions. A teacher resource provides valuable information on inferences, assumptions, and conditions, and how scholars tend to overlook these aspects. It focuses on regression analysis, statistical...
College Board
2017 AP® Statistics Free-Response Questions
Reduce testing anxiety by helping learners prepare for test day. Scholars complete six free-response questions from a released AP® exam. The questions test a variety of concepts including confidence intervals, frequency tables,...
Mathematics Vision Project
Module 9: Statistics
All disciplines use data! A seven-lesson unit teaches learners the basics of analyzing all types of data. The unit begins with a study of the shape of data displays and the analysis of a normal distribution. Later lessons discuss the...
101 Questions
Class Height Distribution
A picture is worth a thousand words, and this is no exception! The introductory photo shows a group of classmates lined up in height categories; females and males are in different colors, and the shape of the curve they create is...
Howard Hughes Medical Institute
Sampling and Normal Distribution
Young scientists learn about sampling and normal distributions through data analysis. A worksheet guides them to better understanding and synthesis of knowledge.
Shodor Education Foundation
Skew Distribution
Slide the class into a skewed view. Learners alter the location of the median relative to the mean of a normal curve to create a skew distribution. They compare the curve to a histogram distribution with the same skewness.
Shodor Education Foundation
Normal Distribution
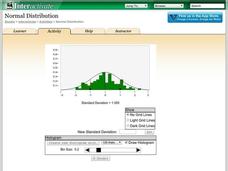
Does the size of the bin matter? The resource allows pupils to explore the relationship between the normal curve and histograms. Learners view histograms compared to a normal curve with a set standard deviation. Using the interactive,...
Shodor Education Foundation
Overlapping Gaussians
Adjust the overlap to compare probabilities. Using sliders, learners adjust the shape of two Gaussian curves. The interactive calculates the area of the left tail for one curve and the right tail for the other. Pupils set the interactive...
Beyond Benign
Can You Hear Me Now? Cell Phone Accounts
How sustainable are cell phones? Throughout the unit, learners explore the issues around cell phones concerning sustainability. Class members take a graphical look at the number of cell phones across the world using a box-and-whisker...
CK-12 Foundation
Properties of a Normal Distribution: Uniform Distributions
There's nothing normal about an extraordinary resource. Scholars change the dimensions of a normal distribution using a slider interactive. Determining the area under the graph gives probabilities for different situations.
CK-12 Foundation
Computing Probabilities for the Standard Normal Distribution: The FDA and Food Safety
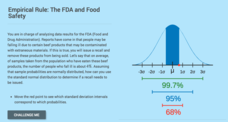
To recall or not to recall, that is the question. Using provided data, pupils calculate the percent of people that may fall ill on average. The scholars determine the standard deviation based upon the mean and the empirical rule, then...
CK-12 Foundation
Normal Approximation of the Binomials Distribution: When to Approximate
Normalizing a binomial distribution — determine when it is all right. Given the rule of thumb of when it is appropriate to use the normal distribution to approximate a binomial distribution, pupils look at different scenarios. Scholars...
Virginia Department of Education
Organizing Topic: Data Analysis
Learners engage in six activities to lead them through the process of conducting a thorough analysis of data. Pupils work with calculating standard deviations and z-scores, finding the area under a normal curve, and sampling techniques....
Virginia Department of Education
Normal Distributions
Pupils work to find probabilities by using areas under the normal curve. Groups work to calculate z-scores and solve real-world problems using the empirical rule or tables.
Statistics Education Web
Walk the Line
How confident are you? Explore the meaning of a confidence interval using class collected data. Learners analyze data and follow the steps to determine a 95 percent confidence interval. They then interpret the meaning of the confidence...
Statistics Education Web
What Does the Normal Distribution Sound Like?
Groups collect data describing the number of times a bag of microwave popcorn pops at given intervals. Participants discover that the data fits a normal curve and answer questions based on the distribution of this data.
EngageNY
Analyzing Decisions and Strategies Using Probability 2
Explore how to compare and analyze different strategies. In the 20th installment of a 21-part module, scholars continue their analysis of decisions and strategies from the previous instructional activity. They then extend this concept to...
Mathematics Vision Project
Module 8: Statistics
What does it mean to be normal in the world of statistics? Pupils first explore the meaning of a normal distribution in the eight-lesson module. They then apply the statistics related to normal distributions such as mean, standard...
Statistics Education Web
Who Sends the Most Text Messages?
The way you use statistics can tell different stories about the same set of data. Here, learners use sets of data to determine which person sends the most text messages. They use random sampling to collect their data and calculate a...


