American Statistical Association
What Fits?
The bounce of a golf ball changes the result in golf, mini golf—and a great math activity. Scholars graph the height of golf ball bounces before finding a line of best fit. They analyze their own data and the results of others to better...
Project Maths
Correlation Coefficient
Of course, there might be a correlation! Young mathematicians investigate several different data sets, create scatter plots, and determine any correlation. They consider whether a causation exists between any of the variables in question.
Project Maths
Introduction to Patterns
The world is full of patterns. Help learners quantify those patterns with mathematical representations. The first Algebra lesson in a compilation of four uses a series of activities to build the concept of patterns using multiple...
101 Questions
Deodorant
Smells like learning! Young scholars collect data on the length of time a stick of deodorant lasts. After modeling the data with a graph and function, they make predictions about deodorant use over time.
Teach Engineering
Determining Densities
Don't be dense—use a robust resource. The second installment of a five-part Floaters and Sinkers unit has learners determine the densities of several objects. As part of the activity, they learn the displacement method for finding...
Teach Engineering
Floaters and Sinkers
Whatever floats your boat. Young engineers learn about density by measuring the masses and volumes of boxes filled with different materials. Using their knowledge of densities, they hypothesize whether objects with given densities will...
Teach Engineering
News Flash!
Extra, extra, read all about it! Scholars research information on endangered species and produce a news report to share their findings with the rest of the class. In groups, they then consider engineering solutions to problems on habitat...
Teach Engineering
Corn for Fuel?!
Can corn power the world? Young scientists learn about how corn and other plants can provide renewable biofuels in the second of nine lessons. They set up an experiment to investigate how different variables affect plant growth. All of...
Teach Engineering
Energy Resources and Systems
We've talked a lot about energy, but where does energy come from? Pupils brainstorm different energy sources through a class discussion to kick off the 14th installment of a 25-part Energy Systems and Solutions unit. They then research...
Teach Engineering
Energy Perspectives
The data says ... the resource is great to use. Using Microsoft Excel, pupils analyze data from the US Department of Energy in the fifth lesson of a 25-part Energy Systems and Solutions unit. Each group looks at a different data set and...
Shodor Education Foundation
Graphit
No graphing calculator? No worries, there's an app for that! Young mathematicians use an app to graph functions. In addition, they can also plot data points.
Shodor Education Foundation
Data Flyer
Fit functions to data by using an interactive app. Individuals plot a scatter plot and then fit lines of best fit and regression curves to the data. The use of an app gives learners the opportunity to try out different functions to see...
Shodor Education Foundation
Scatter Plot
What is the relationship between two variables? Groups work together to gather data on arm spans and height. Using the interactive, learners plot the bivariate data, labeling the axes and the graph. The resource allows scholars to create...
Shodor Education Foundation
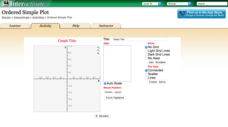
Ordered Simple Plot
Open your imagination to make algebra-inspired creations. An interactive lesson has scholars graph images from a set of parameters. Users can practice minimum values, maximum values, and scale as well as key features.
CK-12 Foundation
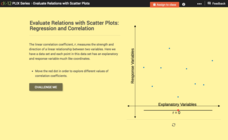
Evaluate Relations with Scatter Plots: Regression and Correlation
Introduce the concept of a correlation coefficient using an interactive lesson. Learners begin by manipulating a correlation coefficient and watching a graph change to represent the new value. Questions help strengthen their...
Teach Engineering
All Fats Are Not Created Equal
Apply robotics to connect physical properties to chemical properties. Future engineers use robots to determine the melting points of various fats and oils. The robots can do this by measuring the translucency of the fats as they heat up.
Noyce Foundation
Through the Grapevine
Teach statistics by analyzing raisins. A thorough activity provides lesson resources for five levels to include all grades. Younger pupils work on counting and estimation, mid-level learners build on their understanding of the measures...
Virginia Department of Education
Linear Curve of Best Fit
Is foot length to forearm length a linear association? The class collects data of fellow scholars' foot length and the length of their forearms. They plot the data and find a line of best fit. Using that line, they make predictions of...
Teach Engineering
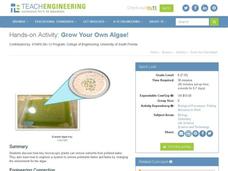
Grow Your Own Algae!
Develop a model of a wastewater treatment center. The last activity of the unit has pupils mix a lake water sample into a tank of water containing fertilizers. Over time, the algae from the lake water grows and removes the nutrient-rich...
Teach Engineering
Microbes Know How to Work!
Scholars harness the power of microbes with an engaging activity that uses yeast to break down sugar in water. Multiple setups of the same experiment lets learners determine which temperature results in the fastest rate of sugar...
Teach Engineering
Air Pollution in the Pacific Northwest
Scholars investigate levels of nitrogen dioxide in the Pacific Northwest by examining the role of nitrogen in air pollution and how remote sensing can be used to measure nitrogen levels. An Excel spreadsheet calculates the difference...
Teach Engineering
Accelerometer: Centripetal Acceleration
Scholars build robotic arms that swing back and forth and use them to collect velocity and acceleration data. To analyze the results, pupils compare data to the equations for angular velocity and centripetal acceleration.
American Statistical Association
How Tall and How Many?
Is there a relationship between height and the number of siblings? Classmates collect data on their heights and numbers of brothers and sisters. They apply statistical methods to determine if such a relationship exists.
American Statistical Association
You and Michael
Investigate the relationship between height and arm span. Young statisticians measure the heights and arm spans of each class member and create a scatter plot using the data. They draw a line of best fit and use its slope to explain the...


