Mathed Up!
Two Way Tables
When presented with categorical data, a two-way frequency table is a great way to summarize the information. Pupils organize categorical data using a two-way table, then use the tables to determine missing data and to calculate simple...
Curated OER
Chairs Around the Table
Youngsters become flexible problem solvers with this challenging lesson. If there are 24 square tables in a restaurant, how many customers can be seated at one time? They can use manipulatives or draw pictures to help them find the...
Utah Education Network (UEN)
Analyze Proportional Relationships and Use Them to Solve Real-World Problems
What proportion of learners will benefit from the lessons on proportional reasoning? Class members learn about proportional relationships, from unit rates to writing equations for proportional relationships. Then, they learn to use...
Curated OER
Getting Started with Interactive Math Notebooks
Set young mathematicians up for success with this interactive math notebook. Including a list of rules and expectations for using the notebooks, as well as templates for a creating a cover page and table of contents, this resource...
Statistics Education Web
Saga of Survival (Using Data about Donner Party to Illustrate Descriptive Statistics)
What did gender have to do with the survival rates of the Donner Party? Using comparative box plots, classes compare the ages of the survivors and nonsurvivors. Using the same method, individuals make conclusions about the gender and...
Curated OER
Student Costs Data Table
Students compare and contrast two routes selected for a virtual field trip. They create a data table of educational activities, lodging, and meal costs using Microsoft Excel software.
CK-12 Foundation
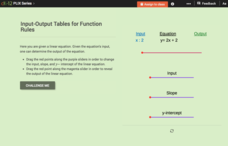
Input-Output Tables for Function Rules
Make the abstract a bit more concrete with an interactive that asks learners to slide an input value through a function to determine the output. Changing the slope and y-intercept allows them to see the how the output values change.
University of Utah
Statistics-Investigate Patterns of Association in Bivariate Data
Young mathematicians construct and analyze patterns of association in bivariate data using scatter plots and linear models. The sixth chapter of a 10-part eighth grade workbook series then prompts class members to construct and interpret...
Newspaper Association of America
Critical Thinking through Core Curriculum: Using Print and Digital Newspapers
What is and what will be the role of newspapers in the future? Keeping this essential question in mind, class members use print, electronic, and/or web editions of newspapers, to investigate topics that include financial literary,...
Open Text Book Store
Arithmetic for College Students: Worksheets
Loaded with concepts ranging from multiplying decimals to converting units to solving problems using the order of operations, a thorough practice packet is perfect for a fifth or sixth grade math classroom.
Statistics Education Web
It’s Elemental! Sampling from the Periodic Table
How random is random? Demonstrate the different random sampling methods using a hands-on activity. Pupils use various sampling techniques to choose a random sample of elements from the periodic table. They use the different samples to...
Mathematics Vision Project
Module 8: Probability
It's probably a good idea to use the unit. Young mathematicians learn about conditional probability using Venn diagrams, tree diagrams, and two-way tables. They also take into consideration independence and the addition rules.
Pennsylvania Department of Education
What is the Chance?
Fourth and fifth graders make predictions using data. In this analyzing data lesson plan, pupils use experimental data, frequency tables, and line plots to look for patterns in the data in order to determine chance. You will need to make...
Virginia Department of Education
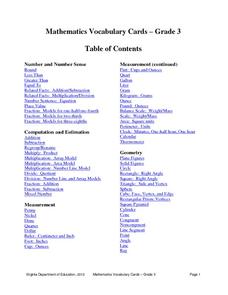
Mathematics Vocabulary Cards - Grade 3
Need to go over some math concepts with your third graders? Use a series of math posters, featuring vocabulary words in geometry, measurement, fractions, probability, and many other areas of study. Each poster presents the term with an...
Achieve
False Positives
The test may say you have cancer, but sometimes the test is wrong. The provided task asks learners to analyze cancer statistics for a fictitious town. Given the rate of false positives, they interpret the meaning of this value in the...
California Education Partners
Linflower Seeds
How does your garden grow? Use proportions to help Tim answer that question. By using their understanding of proportional relationships, pupils determine the number of seeds that will sprout. They create their own linear relationships...
Statistics Education Web
I Always Feel Like Somebody's Watching Me
Future statisticians and potential psychics first conduct an experiment to collect data on whether a person can tell if someone is staring at them. Statistical methods, such as hypothesis testing, chi-square tests, binomial tests, and...
Teach Engineering
Energy Perspectives
The data says ... the resource is great to use. Using Microsoft Excel, pupils analyze data from the US Department of Energy in the fifth lesson of a 25-part Energy Systems and Solutions unit. Each group looks at a different data set and...
Mathed Up!
Cumulative Frequency and Box Plots
Learn how to display data. Young data analysts watch a video to review how to create cumulative frequency histograms and box plots. They work on a set of questions to practice producing these data displays.
Mathematics Vision Project
Features of Functions
What are some basic features of functions? By looking at functions in graphs, tables, and equations, pupils compare them and find similarities and differences in general features. They use attributes such as intervals of...
CCSS Math Activities
Smarter Balanced Sample Items: 6th Grade Math – Target G
Making money and saving money turn into high interest topics for sixth graders. Grade 6 Claim 1 Item Slide Shows use these topics in a presentation with math practice problems. The questions require applying knowledge of algebraic...
Curated OER
Investigation - Mathematical Reasoning: Tables and Chairs
Fourth graders draw pictures and diagrams as they attempt to solve a mathematical problem involving the arrangement of eleven tables shaped like equilateral triangles and the seating of exactly twenty-five people.
Curated OER
Probability Experiment Simulation: Design and Data Analysis Using a Graphing Calculator
Seventh graders simulate probability experiments. Using a graphing calculator, 7th graders design, conduct, and draw conclusions from simulations or probability experiments. Students construct frequency tables and compare the...
California Education Partners
T Shirts
Which deal is best? Learners determine which of two companies has the best deal for a particular number of shirts. They begin by creating a table and equations containing each company's pricing structure. Individuals finish the seventh...


