Kenan Fellows
Man vs. Beast: Approximating Derivatives using Human and Animal Movement
What does dropping a ball look like as a graph? An engaging activity asks learners to record a video of dropping a ball and uploading the video to software for analysis. They compare the position of the ball to time and calculate the...
Curated OER
Capacitors: What Are They?
Learners discover how capacitors help store data. In this computer science activity, students investigate how capacitors can store an electronic charge, eventually helping computers store data. Learners create their own capacitors with...
Shodor Education Foundation
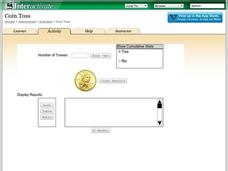
Coin Toss
Are your young mathematicians having a hard time making heads or tails of probabilities? It's no toss up—here is a resource that's sure to straighten them out! Learners run the interactive to toss a coin a different number of times....
NASA
Connecting Models and Critical Questions
Scholars use data to analyze and determine which sets of information need to be counted. They create a model to explain differences among chemical elements using graphs to prove concept mastery.
Curated OER
WS 1.4 Metric Units II
In this metric units worksheet, students convert measurements from one metric unit to another using dimensional analysis. They must show their work to receive credit.
Curated OER
Food chains at sea
Fifth graders interpret a table of data about food chains in the ocean. They create a food chain to represent the information on the table. Periwinkles eat seaweed, and crabs eat periwinkles - so who eats crabs? Extend the activity with...
Curated OER
How Does Water Cool?
How fast does water cool? First fifth graders will draw a line on a graph that predicts how fast they think water can cool from boiling. Then they plot the actual data on the same graph to see if their estimate was correct.
US Department of Commerce
Educational Attainment and Marriage Age - Testing a Correlation Coefficient's Significance
Do women with college degrees get married later? Using a provided scatter plot of the percentage of women who earn bachelor's degrees and the median age at which women first get married over time, pupils conduct a linear regression...
American Statistical Association
Nonlinear Modeling: Something Fishy
There are plenty of fish in the sea, but only a few good resources on regression. Young mathematicians first perform a linear regression analysis on provided weight and length data for fish. After determining that a linear model is not...
EngageNY
Events and Venn Diagrams
Time for statistics and learning to overlap! Learners examine Venn Diagrams as a means to organize data. They then use the diagrams to calculate simple and compound probabilities.
CK-12 Foundation
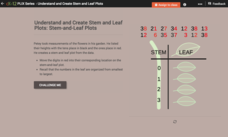
Understand and Create Stem-and-Leaf Plots: Stem-and-Leaf Plots
Explore the advantages to using a stem-and-leaf plot using an online lesson. Learners manipulate an animation to create a stem-and-leaf plot. They then calculate statistics for the data using their display. Guiding questions help them...
Teach Engineering
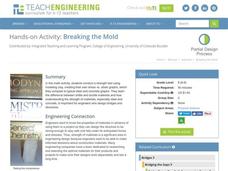
Breaking the Mold
A little too much strain could cause a lot of stress. Groups conduct a strength test on clay. Using books as weights, pupils measure the compression of clay columns and calculate the associated strain and stress. Teams record their data...
Balanced Assessment
Movie Survey
Movie preferences will get your classes talking! Individuals read a pie graph and construct a bar graph using the same information. They then answer questions specific to the data and sample size.
PBL Pathways
Total Cost to Produce the Turbo Blender
Class members blend their knowledge of functions and problem-solving skills to provide business advice to the Turbo Blender manufacturers. Through a project-based approach, learners examine marginal cost data to produce a function. They...
Royal Society of Chemistry
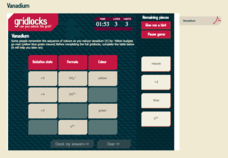
Vanadium
Introduce your chemistry scholars to the periodic table's Goddess of Beauty! Through an interactive that highlights the transition metal vanadium, learners discover the colors produced in solution as vanadium changes oxidation state....
Radford University
Curve of Best Fit
Don't watch the resource go down the drain. Scholars perform an experiment where they measure the amount of water that flows from a funnel over time. They use the data to create graphs and find the curves of best fit.
Curated OER
Analytical Problem Solving
Students explore about propagation of error in calculations using experimental data. They develop their weighing and pipetting techniques. Students explore the following terms: Standard deviation and relative standard deviatin. They...
Curated OER
Fun With Rainfall Measurements
Demonstrate how rain is measured. Pupils will use a rain gauge to measure the amount of rainfall during one week. Then record the data and discuss the results.
Teach Engineering
Insulation Materials Investigation
Don't melt away! Pairs investigate different insulation materials to determine which one is better than the others. Using a low-temp heat plate, the teams insulate an ice cube from the heat source with a variety of substances. They...
Curated OER
James and the Giant Peach Plot Analysis
It's all about the plot, main events, and story mapping with this lesson. As the class reads the novel James and the Giant Peach, they create an excitement graph that actually charts key events and moments of excitement. After creating...
Curated OER
Leveled Problem Solving: Range and Outliers
In this range and outliers worksheet, students solve 6 word problems where they examine data then identify outliers, find the upper and lower quartile ranges, find the interquartile range and create box-and-whisker plots.
Center for History Education
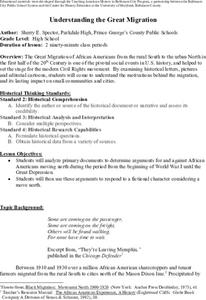
Understanding the Great Migration
What would make someone leave home and travel thousands of miles to find another one? Young historians look at letters, demographic data, and artwork to answer the question for the Great Migration, or the movement of thousands of African...
University of Colorado
Using Spectral Data to Explore Saturn and Titan
Saturn is really far away, but knowledge of its composition is within reach. Future astronomers learn how scientists use spectra to remotely determine the chemical composition of a planet or moon. They try out this concept by analyzing...
Curated OER
Microsoft Office Excel
Middle schoolers use Microsoft Office Excel. In this technology lesson plan, students enter data on a spreadsheet using Excel. This programs tallies data and presents it using graphs.
Other popular searches
- Collecting and Using Data
- Using Databases
- Using Data to Make Predictions
- Graphing Using Census Data
- Using Data Displays
- Organizing Data Using Tables
- Using a Data Table
- Using a Database
- Using Data Tables
- Record Data Using Tally Marks
- Using Data in Science
- Using Data to Solve Problems


