Curated OER
Mrs. Lewis's Pets: Tally Mark Activity
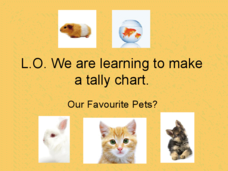
To cute to pass up! This slide show activity has learners count the number of pets Mrs. Lewis has using tally marks. As the show progresses, kids pay attention and make a tally for each type of pet they see. Suggested uses and audio are...
Curated OER
Pet Tally
Give the class an opportunity to practice using tally marks as a way to collect data. As you progress through the slide show, learners tally up the number and types of pets they see, they then use their data to create a tally chart....
Curated OER
Many Ways to Represent Our Data
Demonstrate several ways to represent data with your class. They will use surveys to gather data and display the data using tally charts and graphs. Then answer questions according to the data.
Environmental Protection Agency (EPA)
How Much Water Do You Use?
Incorporate reading strategies, math, research, and the scientific method into one lesson about water conservation. After reading a story about a landlady trying to determine how many people are living in an apartment, learners develop a...
Curated OER
Collect and Organize Data - Practice 14.1
In this data collection worksheet, students read the word problem and study the tally chart about favorite sports. Students then use the information in the chart to answer the questions. Students then use the list about students'...
abcteach
What is Your Favorite Month?
A simple worksheet that helps learners conduct a survey is here for you. In it, pupils collect data on their family and classmate's favorite months. Youngsters use tally marks in the spaces provided to keep track of the answers. Once...
Curated OER
Tossing a Number Cube-- Tally Marks
In this math worksheet, students investigate probability by tossing a number cube 20 times and recording the times that it lands on each number. Tally marks are used to record data. Students then participate in an experiment in...
Curated OER
Recording Data From a Survey Reteaching Worksheet
In this recording data from a surveys reteaching worksheet, 2nd graders review the use of tallies when recording data. They use the information to make a data table and a bar graph that displays the information.
Curated OER
Handling Data: Collecting and Recording Data
Students collect and record data. In this collecting and recording data lesson, students collect data and record that data using frequency tables which include the x and y axis.
Curated OER
What Are Your Favorite Apples?
In this tally learning exercise, students take a survey to determine the favorite apple. They write tally marks beside the apple chosen. For elementary students, this learning exercise may be used for counting purposes and to reinforce...
Curated OER
Creating Tables and Bar Charts
A great way to introduce the concepts of data collection, bar charts, and data analysis. Learners see how their teacher used the data from fifty of her friends to construct a bar chart showing their favorite toys.
Pennsylvania Department of Education
Freckle Face
Students collect and record data. For this early data analysis lesson, students gather data about their partners face. As a class, the students use tally marks and pictographs to record the data and answer question about the information...
Curated OER
Quantitative Data
In this algebra worksheet, students collect data using tally marks. They then record their data, graph it and analyze it. There are 23 questions with an answer key.
Curated OER
The Write Stuff
Fourth graders share a previously written portfolio piece and the class guesses the genre. Students use tally marks to keep track of how many of each piece there are in class. Once the data collection is complete, 4th graders create a...
Curated OER
Data Collection - Primary Poster
Students explore the concept of collecting, analyzing, and graphing data. For this collecting, analyzing, and graphing data lesson, students create a survey about a topic of interest. Students poll their classmates, analyze, and graph...
Curated OER
Frequency Tables; Discrete Ungrouped Data
In this frequency tables worksheet, students utilize given data to work out three frequency charts with one containing values and a pie chart involving angles for each value. Students complete three vertical line diagrams and check all...
Curated OER
Comparing Data on Graph A and Graph B
Second graders gather and graph data. In this graphing lesson, 2nd graders collect data and graph this information using tally charts, bar graphs, pictographs, or tables. They make predictions about the outcomes.
Curated OER
First Grade Shoe Sizes
Third graders collect shoe size data from classmates in their room and another third grade. They predict what the most common shoe size will be. They place the data in an spreadsheet on the computer. They design a graph using the...
Curated OER
Tallies Tell It All
Students explore data collection through the use of tally marks. After a demonstration of the use of tally marks students complete various inquires where they create a chart documenting the number of times a desired result happens. They...
Curated OER
Quantitative Data
In this quantitative data worksheet, pupils compute measures of central tendency, draw vertical line diagrams, and compare collected data. This 23-page worksheet contains approximately 100 multi-step problems. Explanations and examples...
Curated OER
Collect and Organize Data: Homework
In this collecting and organizing data learning exercise, learners use the tally chart for the students' eye color to answer the first two questions. Learners then survey their family for eye color, record those results in a tally chart,...
Curated OER
Favorite Vegetable Survey
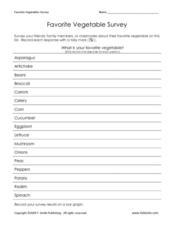
What's your favorite? Use this chart template in your lesson on data collection and graphing. Learners record classmates' favorite vegetable in a survey, and then graph the results. A labelled graph is provided here- print both pages...
Curated OER
Organizing Data
Third graders investigate ways to organize data. In this tally marking lesson plan, 3rd graders practice drawing tally marks to represent an item of data. Students also make connections with skip counting by fives.
Curated OER
Lessons for Atlatl Users with Some Experience-Grade 6
Sixth graders experiment with an atlatl and dart. In this sixth grade data management mathematics lesson, 6th graders explore and determine the most suitable methods of displaying data collected from their experimentation with...


