EngageNY
Estimating Centers and Interpreting the Mean as a Balance Point
How do you balance a set of data? Using a ruler and some coins, learners determine whether the balance point is always in the middle. Through class and small group discussions, they find that the mean is the the best estimate of the...
Bowland
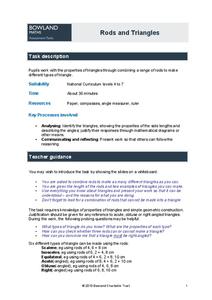
Rods and Triangles
Scholars explore triangles with rods of different lengths. Using rods of 2, 4, 6, 8, and 10 cm class members build as many different types of triangles as they can. They also describe properties of these triangles and determine...
Mathed Up!
Tree Diagrams
Explore how to visually represent probability problems. Scholars watch a video to refresh their memories on tree diagrams. To finish the activity, they complete a activity of questions on this topic.
Illustrative Mathematics
Who is the Tallest?
A simple question, with a not-so-simple answer. Working with whole and mixed number measurements in inches, feet, and yards presents a problem with many possible solutions. A great activity that challenges the minds of young...
Concord Consortium
Square-Ness
Are there some rectangles that are more square than others? A thought-provoking task asks individuals to create a formula that objectifies the square-ness of a set of rectangles. They then use their formulas to rank a set of...
Illustrative Mathematics
Are These Right?
Is that a right triangle or a wrong triangle? Young mathematicians look at eleven different shapes and use a measuring tool of their choice to determine which triangles have right angles. Consider cutting out sets of the shapes to...
Curated OER
How Big is a Foot?
Introducing measurement can be as simple as reading a book and then using measurement tools to understand how big a foot really is. The class reads and discusses the book How Big is a Foot? by Rolf Myller, stopping often to consider...
EngageNY
Fundamental Theorem of Similarity (FTS)
How do dilated line segments relate? Lead the class in an activity to determine the relationship between line segments and their dilated images. In the fourth section in a unit of 16, pupils discover the dilated line...
Inside Mathematics
Graphs (2006)
When told to describe a line, do your pupils list its color, length, and which side is high or low? Use a worksheet that engages scholars to properly label line graphs. It then requests two applied reasoning answers.
Noyce Foundation
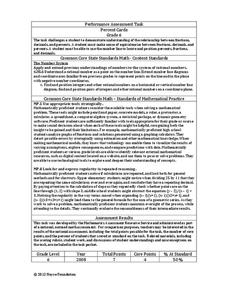
Percent Cards
Explore different representations of numbers. Scholars convert between fractions, decimals, and percents, and then use these conversions to plot the values on a horizontal number line.
EngageNY
An Exercise in Creating a Scale Drawing
Design your dream classroom. The lesson plan contains an exercise to have teams create a scale drawing of their dream classroom. Pairs take the measurements of their classroom and furniture and create a scale factor for them. To finish...
Illustrative Mathematics
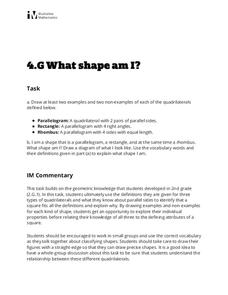
What Shape Am I?
Sharpen your pencil and grab a ruler, it's time to draw some quadrilaterals! Given the definition of a parallelogram, rectangle, and rhombus, learners draw examples and nonexamples of each figure. The three definitions are...
Curated OER
Reflected Triangles
Your learners find and construct the line of reflection between a triangle's pre-image and its reflection image in this short activity.
Balanced Assessment
Sharp-Ness
Transform pupils into mathematicians as they create their own definitions and formulas. Scholars examine an assortment of triangles and create a definition and formula for determining the sharpness of the vertex angle. The groups of...
Virginia Department of Education
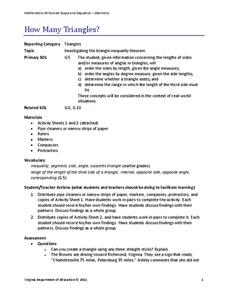
How Many Triangles?
Something for young mathematicians to remember: the sum of any two sides must be greater than the third. Class members investigates the Triangle Inequality Theorem to find the relationship between the sides of a triangle. At the...
Mathed Up!
Fractions, Decimals, and Percentages
After watching a video on making conversions, young mathematicians solve 16 math problems that involve making conversions of fractions to decimals and percents, decimals to fractions and percents, and percents to fractions and...
Bowland
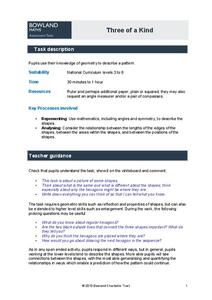
Three of a Kind
One is chance, two is a coincidence, three's a pattern. Scholars must determine similarities and differences of a regular hexagon undergoing dilation. They look at lengths, angles, areas, and symmetry.

