Curated OER
Analyze and Interpret Statistical Information
In this probability and statistics learning exercise, 9th graders analyze and interpret histograms as they identify trends in the data. The two page learning exercise contains four problems. Answers are provided.
Curated OER
COASTAL EROSION
Learners study the coastal erosion or the deposition by waves and sea level rise at a particular area.
California Education Partners
T Shirts
Which deal is best? Learners determine which of two companies has the best deal for a particular number of shirts. They begin by creating a table and equations containing each company's pricing structure. Individuals finish the seventh...
Math Moves U
Collecting and Working with Data
Add to your collection of math resources with this extensive series of data analysis worksheets. Whether your teaching how to use frequency tables and tally charts to collect and organize data, or introducing young mathematicians to pie...
Bowland
Fares Not Fair
What would be a fair fare for a taxi? to answer the questions requires young mathematicians to analyze data on fuel prices and taxi cab fares. They determine and justify a fair fare price.
EngageNY
Mid-Module Assessment Task: Grade 8 Module 6
Make sure pupils have the skills to move on to the second half of the module with a mid-module assessment task. The formative assessment instrument checks student learning before moving on to the rest of the lessons in the unit.
EngageNY
End-of-Module Assessment Task: Grade 8 Module 6
Test your knowledge of linear functions and models. The last installment of a 16-part module is an end-of-module assessment task. Pupils solve multi-part problems on bivariate data based on real-world situations to review concepts from...
Shodor Education Foundation
Life
How does life evolve? The interactive provides a simulation based on the Game of Life invented by mathematician John Conway. Users can run the applet with the preset rules and settings or adjust them to view whether overpopulation or...
Shodor Education Foundation
Rabbits and Wolves
A change in a parameter can end in overpopulation. The resources gives pupils the opportunity to control the parameters of rabbits and wolves in a natural setting. Using the set parameters, the simulation runs and displays the population...
Shodor Education Foundation
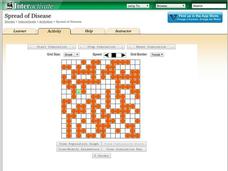
Spread of Disease
Control the spread of a contagious disease. An applet allows pupils to run a simulation on the spread of a disease. Rules govern how the disease is spread and the length of time it takes to recover. Learners view the spread visually and...
Concord Consortium
People and Places
Graph growth in the US. Given population and area data for the United States for a period of 200 years, class members create graphs to interpret the growth over time. Graphs include population, area, population density, and population...
US Department of Commerce
Featured Activity: Population Change Over Time
Keep track of a state's population. After a brief discussion on how population data is used for funding, individuals look at population changes over time. Pupils find the population of two states using three different censuses. They then...
Curated OER
Rock On
Students analyze trends in the Grammy Award winners this year and create graphs displaying their findings.
Curated OER
The International Space Station
In this International Space Station instructional activity, students are given the altitude changes in the space station on a graph from 2000-2004. Students answer 5 questions about the trends in the graph, the changes in altitude, the...
Curated OER
West Nile Virus and Lyme Disease: Making Sense of the Numbers
In an interdisciplinary exploration, trace the development of West Nile fever and Lyme diseases. Pupils discover how these diseases are contracted. They collect statistical data and analyze trends.
Curated OER
Comparison of Two Different Gender Sports Teams - Part 3 of 3 Scatter Plots and Lines of Best Fit
Students create a scatter plot for bivariate data and find the trend line to describe the correlation for the sports teams. In this scatter plot lesson, students analyze data, make predictions,and use observations about sports data...
Curated OER
Climate change in Canada
Students investigate the impact of human activity on the environment. In this secondary math/science lesson, students analyze and interpret information from data and graphs as they investigate trends in climate change and the reasons...
Curated OER
Problem Solving with Batting Averages
Fifth graders use data from an Excel document to analyze and predict trends in batting averages.
Curated OER
The Correlation Between Human Population Growth and Dwindling Natural Resources
Eighth graders predict human population growth. In this lesson plan, 8th graders discuss the length of time needed to double the human population, work in groups to chart population growth and predict population growth in the...
Curated OER
Current Events Research
Young scholars monitor current events using on-line and traditional resources. They explore issues such as what trends they see developing in specific news issues over time and how different news stories might be interrelated.
Curated OER
A Statistical Look at Jewish History
Students complete their examination over the Jewish Diaspora. Using population figures, they discover the importance of percentages in exploring trends. They use their own ethnic group and determine how it is represented in the United...
Curated OER
Bird airport control
Students identify the various species of birds found in the wetlands. Students observe and record the key skills involved in scientific inquiry. Students handle and interpret data gathered on a field trip which reveals patterns and...
Curated OER
Trouble in the Troposphere
Students Use data sets from MY NASA DATA to produce graphs comparing monthly and yearly ozone averages of several U.S. cities. They analyze and evaluate the data and predict trends based on the data. In addition, they discuss and...
Curated OER
Math Investigations Facilitation Plan
In this math lesson plan, students choose a topic involving math that interests them to investigate or research. Students make a plan detailing how they will investigate their topic; such as, keeping track of plant heights over time,...
Other popular searches
- Periodic Table Trends
- Periodic Trends
- Fashion Trends
- Employment Trends
- Cultural Trends
- The Periodic Table Trends
- Health Trends
- Popular Trends
- Food Trends in the Uk
- Economic Trends
- Long Term Trends
- Population Trends


