Soft Schools
Plot — 3rd or 4th Grade
After reading a version of "The Tortoise and the Hare," scholars complete a plot diagram. They pinpoint the tale's beginning, rising action, climax, falling action, and ending.
Mathed Up!
Stem and Leaf Diagrams
Order the data within a stem-and-leaf display. Pupils take data and create and ordered stem-and-leaf diagrams, including the key. Participants take their data and determine answers about the information. Class members then find measures...
Jordan-Granite Consortium
Scatter Diagram
You aced the first test, so your score on the second one shouldn't matter, right? Young pupils first draw a best fit line on a provided scatter plot showing test scores for two different tests. They then evaluate five statements on the...
Curated OER
Plot Diagram
In this plot diagram worksheet, students fill in a diagram: introduction, rising action, climax, falling action and resolution. Worksheet is designed to be used with an interactive whiteboard.
Inside Mathematics
Scatter Diagram
It is positive that how one performs on the first test relates to their performance on the second test. The three-question assessment has class members read and analyze a scatter plot of test scores. They must determine whether...
Curated OER
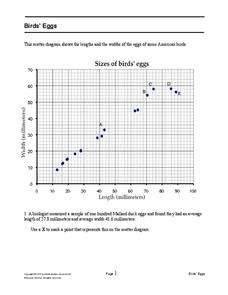
Birds' Eggs
More than just data, scatter plots are full of information that can be used to answer a variety of questions. This lesson uses a plot with information about bird egg sizes to answer questions about the relationship between length and...
Willow Tree
Box-and-Whisker Plots
Whiskers are not just for cats! Pupils create box-and-whisker plots from given data sets. They analyze the data using the graphs as their guide.
Curated OER
Post Assessment: Plot Elements and Characterization
Learners use the provided worksheet to identify plot elements and then fill in these elements on a plot diagram. Also included is a template for a character map that asks readers to choose a character, identify two traits, and supply...
Curated OER
Marking Time
Two narrative excerpts tell the same story from different points of view. In the first excerpt (first person), sequencing words and phrases are bolded and learners write down what the bold type does. The second excerpt is in third...
CCSS Math Activities
Scatter Diagram
Don't let a great resource scatter to the winds. Pupils analyze two sets of test scores on a scatter plot. They draw a line of best fit and use it to make predictions about the test scores. They also consider any apparent trends in the...
Mathematics Assessment Project
Temperatures
As a middle school assessment task, learners first examine line graphs of monthly temperatures for two locations, and then match box plots to each line plot.
Curated OER
Scatter Diagrams and Curve Fitting
In this Scatter Diagrams and Curve Fitting worksheet, students are guided in how to graph a scatter diagram (plot) and a Best Fit Line using a TI-83 graphing calculator.
Centre for Innovation in Mathematics Teaching
Ten Data Analysis Activities
This thirteen page data analysis worksheet contains a number of interesting problems regarding statistics. The activities cover the concepts of average measurements, standard deviation, box and whisker plots, quartiles, frequency...
Curated OER
Data Collection and Presentation
Middle and high schoolers collect and analyze data from four different activities. The activities include information about classmates, tallying colors of cars in a parking lot, stem and leaf plots, and making a histogram from winning...
Inside Mathematics
Archery
Put the better archer in a box. The performance task has pupils compare the performance of two archers using box-and-whisker plots. The resource includes sample responses that are useful in comparing individuals' work to others.
Inside Mathematics
Population
Population density, it is not all that it is plotted to be. Pupils analyze a scatter plot of population versus area for some of the states in the US. The class members respond to eight questions about the graph, specific points and...
Mathematics Assessment Project
Bird’s Eggs
Are the length and width of birds' eggs related? Young ornathologists use a scatter plot to investigate the relationship between the length and width of eggs for Mallard ducks. They then determine the egg with the greatest...
Inside Mathematics
Snakes
Get a line on the snakes. The assessment task requires the class to determine the species of unknown snakes based upon collected data. Individuals analyze two scatter plots and determine the most likely species for five additional data...
Curated OER
Plotting Points
In this coordinate pairs learning exercise, students learn to plot points on a graph. Students study the examples and then complete 20 questions. This is intended as an online activity, but may be completed with pencil and paper.
Curated OER
Short-Run and Long-Run Competitive Equilibrium
Calculate profit and loss, plot on diagrams, and solve problems for given scenarios and variables in this 3-page worksheet. Students will obtain excellent practice after completing these pages.
Curated OER
Study Guide: "The Gift of the Magi"
In this study guide worksheet, students define vocabulary and literary terms found in "The Gift of the Magi". Students also complete a plot diagram, find examples of literary term usage, and answer comprehension questions based on the...
Curated OER
Quartiles and Box-and-Whisker Plots
In this algebra worksheet, students identify the central tendencies as they solve a box and whisker plot graph. They identify the quartiles of the data. There are 4 questions with an answer key.
Curated OER
Geometry Coordinates
In this geometry coordinates learning exercise, students plot given ordered pairs. This one-page learning exercise contains 6 problems.
Noyce Foundation
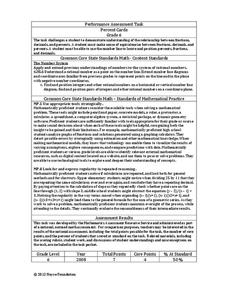
Percent Cards
Explore different representations of numbers. Scholars convert between fractions, decimals, and percents, and then use these conversions to plot the values on a horizontal number line.


