EngageNY
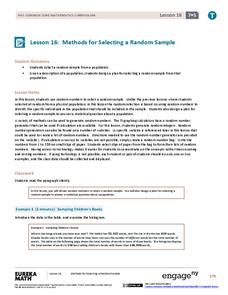
Methods for Selecting a Random Sample
Random sampling is as easy as choosing numbers. Teams use random numbers to create a sample of book lengths from a population of 150 books. The groups continue by developing a technique to create samples to compare from two populations...
EngageNY
Using Sample Data to Compare the Means of Two or More Populations
Determine whether there is a difference between two grades. Teams generate random samples of two grade levels of individuals. Groups use the mean absolute deviation to determine whether there is a meaningful difference between the...
Curated OER
Using Random Sampling to Draw Inferences
Emerging statisticians develop the ability to make inferences from sample data while also working on proportional relationships in general. Here, young learners examine samples for bias, and then use random samples to make inferences...
College Board
Random Variables vs. Algebraic Variables
Variables can vary in meaning. A reference material for AP® Statistics explains the difference between random and algebraic variables. It provides a hypothetical situation involving dice—great for use in a classroom situation.
EngageNY
Types of Statistical Studies
All data is not created equal. Scholars examine the different types of studies and learn about the importance of randomization. They explore the meaning of causation and when it can be applied to data.
American Statistical Association
How Random Is the iPod’s Shuffle?
Shuffle the resource into your lesson plan repertoire. Scholars use randomly-generated iPod Shuffle playlists to develop ideas about randomness. They use a new set of playlists to confirm their ideas, and then decide whether the iPod...
Curated OER
Estimating the Mean State Area
Seventh grade statisticians randomly select five states and then determine the mean area. The class then works together to create a dot plot of their results.
Curated OER
Designing Models to Simulate Actual Events Using a Random Number Generator
Students design models to simulate actual events using a random number generator on a calculator. They estimate the likelihood of a particular outcome using results of simulations. Answer Key included.
Curated OER
Populations Lab - Cultures Lesson: Statistics / Sampling Patterns
Ninth graders examine the application of statistical sampling, data collection, analysis, and representation that exists in schooling and teenage lifestyles in Japan and the United States.
Curated OER
Statistics
Seventh and eighth graders solve and complete three various types of problems. First, they find the median rate using the box-and-whisker plot shown. Then, learners describe the inter-quartile range. In addition, they determine whether...
American Psychological Association
A Tasty Sample(r): Teaching about Sampling Using M&M’s
Here's a sweet activity! As part of a study of psychological research methods and statistic gathering, individuals develop a hypothesis about the number of each color of M&Ms in a fun-size package. They then count the number of each...
EngageNY
Experiments and the Role of Random Assignment
Time to experiment with mathematics! Learners study experimental design and how randomization applies. They emphasize the difference between random selection and random assignment and how both are important to the validation of the...
Curated OER
Random Statistics
Seventh and eighth graders solve and complete 20 various types of short answer problems. First, they write a brief description of themselves including those as stated. Then, learners categorize the type of sampling used in various...
EngageNY
Random Sampling
Sample pennies to gain an understanding of their ages. The 16th installment of a 25-part series requires groups to collect samples from a jar of pennies. Pupils compare the distribution of their samples with the distribution of the...
EngageNY
Using Sample Data to Compare the Means of Two or More Populations II
The 23rd segment in a series of 25 presents random samples from two populations to determine whether there is a difference. Groups determine whether they believe there is a difference between the two populations and later use an...
EngageNY
Sampling Variability
Work it out — find the average time clients spend at a gym. Pupils use a table of random digits to collect a sample of times fitness buffs are working out. The scholars use their random sample to calculate an estimate of the mean of the...
Statistics Education Web
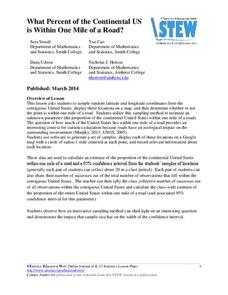
What Percent of the Continental US is Within One Mile of a Road?
There are places in the US where a road cannot be found for miles! The lesson asks learners to use random longitude and latitude coordinates within the US to collect data. They then determine the sample proportion and confidence interval...
Mathematics Assessment Project
Statistics and Probability
Quickly assess basic understandings of statistics and probability. The resource contains five quick tasks from the probability and statistics domain. The questions range from finding simple conditional probabilities to measures of center...
College Board
2007 AP® Statistics Free-Response Questions Form B
So that is how they do it! Pupils and teachers see how College Board assesses topics using the free-response questions from Form B of the 2007 AP® Statistics test. The six questions are divided in two sections, the first five being more...
College Board
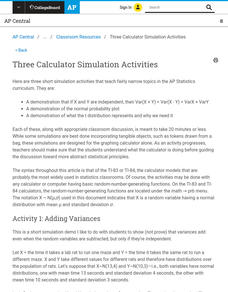
Three Calculator Simulation Activities
Calculators sure come in handy. An AP® Statistics instructional resource provides suggestions for using calculator simulations. It gives activities for adding variances, normal probability plots, and t distributions.
Achieve
False Positives
The test may say you have cancer, but sometimes the test is wrong. The provided task asks learners to analyze cancer statistics for a fictitious town. Given the rate of false positives, they interpret the meaning of this value in the...
Curated OER
Interpreting Data and Statistics
Students define random sample and complete surveys. In this algebra lesson, students create surveys and define the way people analyze these results. They discuss random sample as it relates to the Great Depression and come up with their...
Curated OER
Probability- Two Events
In this statistics activity, students examine different events after translating the word problems into equations and choose which event is most likely to occur. There are 14 questions with an answer key.
Curated OER
Designing Samples/Simple Random Samples
Students consider the advantages and disadvantages of various sampling techniques. They define a simple random sample and identify possible sources of bias in other types of samples. Answer Key included.


