Virginia Department of Education
May I Have Fries with That?
Not all pie graphs are about pies. The class conducts a survey on favorite fast food categories in a lesson on data representation. Pupils use the results to create a circle graph.
Virginia Department of Education
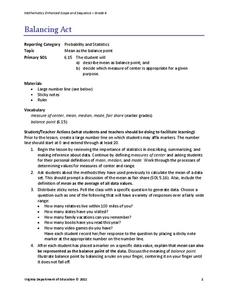
Balancing Act
How many different interpretations of the mean are there? Scholars place numbers on a number line and determine the mean. They interpret the mean as the average value and as the balance point.
Beyond Benign
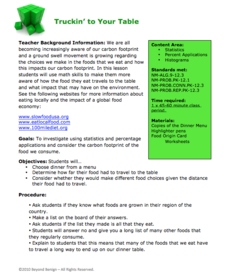
Truckin’ to Your Table
Food takes a trip to the table. Class members choose a meal from a menu and calculate the total cost of the meal including tax and tip. Using a food origin card, pupils determine how far each of the ingredients of a meal traveled to end...
Missouri Department of Elementary
Fly Your Kite
Encourage scholars to become a productive community member with a kite-themed lesson plan. Following a review and discussion, learners complete a Venn diagram that displays the connection between character traits needed to make a home...
Curated OER
Influence and Outliers
Using the TI-Nspire calculator, statisicians identify outliers and their effect on the least-squares regression line. In finding the line of best fit, they determine what points will affect the least squares regressions and what points...
American Statistical Association
Scatter It! (Predict Billy’s Height)
How do doctors predict a child's future height? Scholars use one case study to determine the height of a child two years into the future. They graph the given data, determine the line of best fit, and use that to estimate the height in...
Statistics Education Web
What Does the Normal Distribution Sound Like?
Groups collect data describing the number of times a bag of microwave popcorn pops at given intervals. Participants discover that the data fits a normal curve and answer questions based on the distribution of this data.
Curated OER
US Households
Learners construct and use inverse functions to model a real-world context. They use the inverse function to interpolate a data point.
Museum of the Moving Image
Evaluating Information: Focus on the 2008 Election
Just how true is the information contained in political ads? Determining the veracity of campaign ads from the 2008 presidential race is the focus of a lesson that introduces class members to several fact-checking resources.
Statistics Education Web
The United States of Obesity
Mississippi has both the highest obesity and poverty rate in the US. Does the rest of the data show a correlation between the poverty and obesity rate in a state? Learners tackle this question as they practice their skills of regression....
Federal Reserve Bank
Arts and Economics Infographic Questionnaire
How do careers in the arts contribute to America's gross domestic product? Use an informative infographic that details the economic details of careers in the core arts, including design services, performing arts, and arts education, to...
American Statistical Association
How Random Is the iPod’s Shuffle?
Shuffle the resource into your lesson repertoire. Scholars use randomly-generated iPod Shuffle playlists to develop ideas about randomness. They use a new set of playlists to confirm their ideas, and then decide whether the iPod randomly...
Statistics Education Web
The Egg Roulette Game
Hard boiled or raw? Which egg will you get? A hands-on activity has scholars explore the impact of conditional probability. Based on a skit from the Tonight Show, pupils model the selection of the two types of eggs using beads. They...
Education World
The African American Population in US History
How has the African American population changed over the years? Learners use charts, statistical data, and maps to see how populations in African American communities have changed since the 1860s. Activity modifications are included to...
Curated OER
Student Cancer Journals -- Personal Reflections and Research on Life and Death Issues
Concepts learned in the study of mitosisand biochemistry help when making life or death decisions. Compile a notebook or portfolio of work related to the project can make the research more organized and relevant.
Curated OER
Science NetLinks: Hollywood Dinosaurs
Young scholars use relevant evidence and logical reasoning to construct theories for dinosaur behavior. They examine recent evidence that challenges a prevailing dinosaur theory.
Other popular searches
- Data, Census, & Statistics
- Probability and Statistics
- Educational Statistics
- Baseball Statistics
- Math Statistics
- Climate Statistics
- Math Lessons Statistics
- Median and Mean Statistics
- Statistics Lesson Plans
- Sports and Statistics
- Probability Statistics
- Black Plague Statistics


