Balanced Assessment
Toilet Graph
Mathematics can model just about anything—so why not simulate the height of water in a toilet bowl? The lesson asks pupils to create a graphical model to describe the relationship of the height of the water as it empties and fills again....
Curated OER
Graphing Exponential Functions
Explore the concept of graphing exponential functions. High school mathematicians are given exponential functions such as y=2*3^x, and they graph them on a coordinate plane. They are given two exponential graphs and must write an...
Inside Mathematics
Graphs (2007)
Challenge the class to utilize their knowledge of linear and quadratic functions to determine the intersection of the parent quadratic graph and linear proportional graphs. Using the pattern for the solutions, individuals develop a...
Inside Mathematics
Graphs (2004)
Show your pupils that perimeter is linear and area is quadratic in nature with a short assessment task that requests learners to connect the graph and equation to a description about perimeter or area. Scholars then provide a...
Houston Area Calculus Teachers
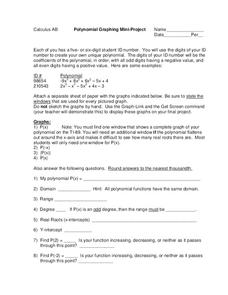
Polynomial Graphing
Your AP Calculus learners probably have their ID numbers memorized, but have they tried graphing them? Pique your pupils' interest by asking each to create a unique polynomial function based on their ID numbers, and then analyze the...
Balanced Assessment
A Run for Two
Develop a graph to represent the distance between two cars. The assessment task presents a scenario in which two cars are traveling at constant speeds with one faster than the other. Pupils develop graphical representations to show the...
Curated OER
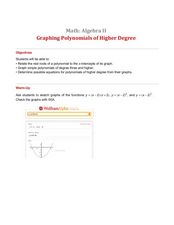
Graphing Polynomials of Higher Degree
Using Wolframalpha graphing capabilites, algebra learners graph polynomials with degrees of three and larger. They identify the roots and graph each polynomial, predict zeros and shapes of graphs, and validate their understanding through...
Curated OER
Graphs and Transformations of Functions
Is it possible to solve quadratic equations by factoring? It is, and your class will graph quadratic equation and functions too. They perform transformation on their graphs showing increasing and decreasing intervals, domain, and range....
EngageNY
The Graph of the Natural Logarithm Function
If two is company and three's a crowd, then what's e? Scholars observe how changes in the base affect the graph of a logarithmic function. They then graph the natural logarithm function and learn that all logarithmic functions can be...
Curated OER
Hyperbolas: Sketching from the Equation
In this algebra worksheet, learners sketch graphs of hyperbolas after solving equations to standard form and interpreting the center, vertices, foci, axis, asymptotes, and eccentricity from the equation. There are 58 questions.
Charleston School District
Sketching a Piecewise Function
How do you combine linear and nonlinear functions? You piece them together! The lesson begins by analyzing given linear piecewise functions and then introduces nonlinear parts. Then the process is reversed to create graphs from given...
Concord Consortium
Writing and Sketching II
Find the function that fits. Scholars first identify the graph of a function that looks the same after a horizontal translation. They must then find the equation of a function whose graph lies only in two adjacent quadrants.
Concord Consortium
Writing and Sketching I
Writing and sketching functions—what more could you want to do? Learners write and sketch functions that meet certain conditions as they complete a short task. They find a parabola that encompasses three quadrants of the coordinate plane...
Flipped Math
Unit 5 Review: Systems of Equations
Activate transformers along with algebra systems. Pupils use 10 problems to review transformations of functions to solve a variety of systems of equations. Individuals identify the types of transformations from an equation along with...
Concord Consortium
Graphical Depictions
Parent functions and their combinations create unique graphical designs. Learners explore these relationships with a progressive approach. Beginning with linear equations and inequalities and progressing to more complex functions,...
Flipped Math
Sketching Polynomial Functions
Provide a sketch of the suspect. Scholars see how to use the key aspects they know about polynomials to create a sketch of the graph. Learners factor to calculate the zeros by factoring, find the end behavior, and determine the...
HHS Math
Group Worksheet 1F - Graphing and Finding Zero
Graph quadratic functions and find the zero in this worksheet. Twelve problems range from those that could be quickly factored and graphed, to those that require use of the quadratic formula and their graphs approximated. Solutions...
Illustrative Mathematics
Transforming the Graph of a Function
Function notation is like a code waiting to be cracked. Learners take the graph of an unknown equation and manipulate it based on three different transformation changes of the function equation. The final step is to look at three points...
Balanced Assessment
Bathtub Graph
Represent the relationship between independent and dependent variables through a modeling situation. The activity expects learners to graph the volume of water in a bathtub during a given scenario. The graph should result in two areas of...
Curated OER
Exploring Quadratic Data : Transformation Graphing
High schoolers analyze the vertex form of a parabola and find an approximate fit of a model. They explain the quadratic parabola function and its properties by developing quadratic models. They use translation and dilation to change the...
Curated OER
Graphing
In this graphing worksheet, students sketch graphs of given polynomial equations. They draw line graphs to show sign changes in specified forms. This one-page worksheet contains ten problems. Answers are provided at the bottom of the...
Balanced Assessment
Cost of Living
Math scholars investigate the cost of living in Hong Kong compared to Chicago but must first convert the different types of currency. They then choose a type of graph to compare different spending categories and finish the activity by...
Curated OER
Spaghetti Graphs
Students work in pairs to test the strength of spaghetti strands. They collect and graph data to determine a line of best fit. Students create a linear equation to interpret their data. Based on the data collected, students predict...
Mt. San Antonio Collage
Test 1: Functions and Their Graphs
Save the time creating an assessment because these function problems should do the trick. With 10 multi-part questions, they each focus on a different topic including radical, polynomial, linear and piecewise functions. The majority of...


