CCSS Math Activities
Smarter Balanced Sample Items: High School Math – Target J
Good graphs make solving systems simpler. Pupils answer 18 questions shown in a PowerPoint presentation as part of the Claim 1 Item Slide Show series. By considering these questions, they review the concepts of graphing equations and...
CCSS Math Activities
Smarter Balanced Sample Items: 8th Grade Math – Claim 2
Math can be a problem in eighth grade. Sample items show how problem solving exists within the eighth grade standards. Part of the Gr. 8 Claim 2 - 4 Item Slide Shows series, the presentation contains eight items to illustrate the...
CCSS Math Activities
Smarter Balanced Sample Items: 8th Grade Math – Claim 3
Communication is the key. A dozen sample items require scholars to communicate their reasoning involved in arriving at a solution. The PowerPoint from the Gr. 8 Claim 2 - 4 Item Slide Shows series uses a variety of content to illicit...
EngageNY
Grade 5 Math Module 1, Topic D, Lesson 9
Introduces addition of decimals by using unit notation to represent the problem. Pupils use a place value chart to decompose the numbers and then add before connecting to the standard algorithm.
Inside Mathematics
Winning Spinners
Winning a spin game is random chance, right? Pupils create a table to determine the sample space of spinning two spinners. Individuals determine the probability of winning a game and then modify the spinners to increase the probability...
Curated OER
Designing Samples/Simple Random Samples
Students explore the concept of sampling techniques. In this sampling techniques lesson, students identify possible sources of bias in situations such as phone polls, supermarket surveys, and drawing names from a phone book. Students...
Willow Tree
Histograms and Venn Diagrams
There are many different options for graphing data, which can be overwhelming even for experienced mathematcians. This time, the focus is on histograms and Venn diagrams that highlight the frequency of a range of data and overlap of...
Curated OER
Observing the Evidence
Fifth graders explore how to do research from a large group. They explore how to choose a representative sample and collect data from it.
Indiana Department of Education
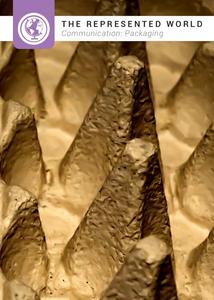
The Represented World: Communication—Packaging
Challenge your classes to design and market a new product. Collaborative groups use geometry skills to create packaging for their products. Finally, they plan a marketing strategy to present to a marketing specialist.
University of North Carolina
Fallacies
All teacher workrooms contain a coffee maker, therefore all teachers must be addicted to coffee. That sentence represents a logical fallacy (although it may be true from some), a topic the seventh installment in the 24-part Writing the...
Curated OER
Sampling Techniques
Sixth graders examine how to select samples and apply them to an experiment. For this sampling lesson, 6th graders use a bag of yellow and blue cubes to take a sample. They predict how many of each color there are the bag. They set up...
Curated OER
Parts Per Hundred (ppH)
In this parts per hundred instructional activity, students read about describing components of a population by parts per a given number such as 100, 100 or 1 million. Students are given 6 problems to calculate the parts per hundred for...
Curated OER
Research Methods in Psychology
This 5-question psychology review provided by Sparknotes addresses sampling bias, correlative data, statistical significance, and more.
Bowland
Soft Drinks
"Statistics are no substitute for judgment" - Henry Clay. Young mathematicians use provided statistics from a soda taste test to explain why conclusions are faulty. They devise a new test that would be more appropriate than the one given.
EngageNY
Creating a Dot Plot
Which dot am I? Pupils create dot plots to represent sample data through the use of frequency tables. The third segment in a series of 22 asks individuals to analyze the dot plots they created. The scholars translate back and forth...
Curated OER
Estimating the Mean State Area
Seventh grade statisticians randomly select five states and then determine the mean area. The class then works together to create a dot plot of their results.
Marilyn Burns Education Associates
Eighteen Flavors
Your learners will be tantalized by this inquiry-based, collaborative activity as they discover how to write an equation that represents the height of an ice cream cone. Given the scenario based on the poem, "Eighteen Flavors," and...
Curated OER
Surveys and Samples
In this surveys and samples activity, students discover data collection techniques and write their own survey questions. Students use random sampling, convenience sampling, and systemic sampling and analyze their results.
Curated OER
Bias Sampling
Students explore statistics by conducting a scientific study. In this data analysis lesson, students conduct a class poll about popular foods of their classmates. Students complete a worksheet and discuss how bias opinions affect the...
Curated OER
Designing a Study
Students explore features to consider when designing a scientific study. In this science research lesson, students examine different methods of data collection and consider which method would be appropriate for determining how many types...
Curated OER
Integrated Algebra Regents Questions: Combinations and Probability
In this combinations and probability worksheet, students solve 3 short answer problems. Students draw tree diagrams to represent possible outcomes in a sample space. Students determine the probability of an event.
Statistics Education Web
Who Sends the Most Text Messages?
The way you use statistics can tell different stories about the same set of data. Here, learners use sets of data to determine which person sends the most text messages. They use random sampling to collect their data and calculate a...
EngageNY
Margin of Error When Estimating a Population Mean (part 2)
Don't leave your classes vulnerable in their calculations! Help them understand the importance of calculating a margin of error to represent the variability in their sample mean.
EngageNY
End-of-Module Assessment Task: Grade 7 Mathematics Module 5
Show learners how to use simulations and random sampling to reach conclusions with the last resource in a 25-part series. The assessment contains three scenarios, each with several parts, and covers comparing populations using random...


