EngageNY
Modeling a Context from Data (part 2)
Forgive me, I regress. Building upon previous modeling activities, the class examines models using the regression function on a graphing calculator. They use the modeling process to interpret the context and to make predictions...
Texas Instruments
Finding Linear Models Part III
Explore linear functions! In this Algebra I instructional activity, mathematicians graph data in a scatter plot and use a graphing calculator to find a linear regression and/or a median-median line. They use the model to make predictions.
EngageNY
Modeling Relationships with a Line
What linear equation will fit this data, and how close is it? Through discussion and partner work, young mathematicians learn the procedure to determine a regression line in order to make predictions from the data.
Virginia Department of Education
Exponential Modeling
Investigate exponential growth and decay. A set of six activities has pupils collecting and researching data in a variety of situations involving exponential relationships. They model these situations with exponential functions and solve...
Virginia Department of Education
Logarithmic Modeling
Explore logarithms and logarithmic regression. Young mathematicians first learn about inverse functions and about the logarithm function family. They take their newfound knowledge to use logarithmic functions to model situations and...
Virginia Department of Education
Linear Modeling
An inquiry-based algebra activity explores real-world applications of linear functions. Scholars investigate four different situations that can be modeled by linear functions, identifying the rate of change, as well as the...
Curated OER
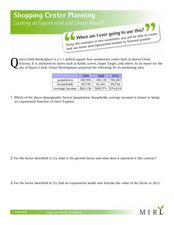
Looking at Exponential and Linear Models
In this shopping center worksheet, students use exponential and linear models to complete word problems about a shopping center. Students complete 6 problems.
Firelands Local Schools
Exponential Growth and Decay
How can you safely model exponential growth and decay? A hands-on activity uses candies to model not only exponential decay, but also exponential growth. Exponential equations are fitted by hand and by use of a calculator...
Curated OER
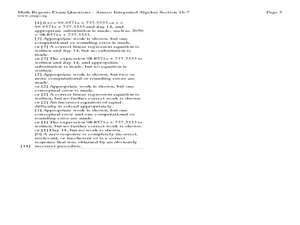
Fourteen Math Regent Exam Statistics Questions on Scatter Plots and Linear Regression
In this linear regression worksheet, students solve fourteen Math Regent Exam questions regarding scatter plots and linear regression. The solutions are provided.
Balanced Assessment
Monitor Pricing
Out with the old and in with the new. Learners use a set of prices of computer monitors from 1994 to make a prediction. They then use one current price and what they know about the old prices to make a more recent prediction. Their...
Curated OER
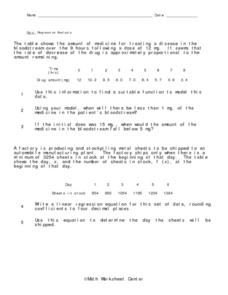
Regression Analysis
In this regression analysis instructional activity, 9th graders solve 10 different word problems related to regression analysis. First, they use the information given to find a suitable function to model the data. Then, students use the...
Statistics Education Web
The United States of Obesity
Mississippi has both the highest obesity and poverty rate in the US. Does the rest of the data show a correlation between the poverty and obesity rate in a state? Learners tackle this question as they practice their skills of regression....
Virginia Department of Education
Curve of Best Fit
Which function models the data best? Pupils work through several activities to model data with a variety of functions. Individuals begin by reviewing the shapes of the functions and finding functions that will fit plotted data points. By...
Statistics Education Web
Text Messaging is Time Consuming! What Gives?
The more you text, the less you study. Have classes test this hypothesis or another question related to text messages. Using real data, learners use technology to create a scatter plot and calculate a regression line. They create a dot...
Curated OER
Strike a Pose: Modeling in the Real World (There's Nothing to It!)
Adjust this lesson to fit either beginning or more advanced learners. Build a scatter plot, determine appropriate model (linear, quadratic, exponential), and then extend to evaluate the model with residuals. This problem uses real-world...
Curated OER
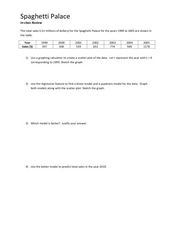
Spaghetti Palace
In this spaghetti palace worksheet sheet, students examine data and create a scatter plot. They use their graphing calculator to find a linear model and a quadratic model for given information. Students predict total...
Curated OER
Scatterplots and Regressions
For this scatterplots and regressions worksheet, students solve 6 different types of problems related to graphing scatterplots and interpreting regressions. First, they create a scatterplot from the given data coordinates and then,...
Community Partnerships for Adult Learning
Goals Setting
You can reach your goals, if you're SMART about it! Teach your class to how build specific goals that include all the elements of the acronym SMART. The plan includes detailed procedures for the teacher and requires pupils to...
Curated OER
Lesson 6-7: Scatter Plots and Equations of Lines
In this scatter plot worksheet, students examine tables and write a linear equation that matches the table. Students graph linear equations. They read scatter plots, determine the trend line, and write a linear equation to...
Curated OER
Scatter Diagrams and Curve Fitting
In this Scatter Diagrams and Curve Fitting worksheet, students are guided in how to graph a scatter diagram (plot) and a Best Fit Line using a TI-83 graphing calculator.
Curated OER
Business & Statistics: Final Exam
In this business and statistics worksheet, learners read real-life business problems, arrange data, and identify the probability method best used to determine the answer. They identify the type of random sample, draw stem-and-leaf plots,...
Curated OER
Exponential Population Growth
In this exponential population growth worksheet, students read word problems and determine the exponential growth of a specified populations. They find the percent of growth and compute exponential regressions. Students graph...
Curated OER
Quadratic Applications
In this quadratic applications worksheet, students complete graphs, charts, comparison charts, and more having to do with quadratic equations. Students complete 5 different activities.
Curated OER
Good Mental Health Word Search
In this word search worksheet, students identify fifty words related to good mental health in a word puzzle. Examples include hormones, self esteem, and depressed.


