PBIS World
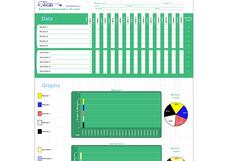
Behavior and Intervention Tracking Form
Keep a record of behavior intervention using this form. On this page, you can note down the problem behavior, three Tier 1 interventions put in place to address the behavior, and notes on the results of each intervention.
Science Geek
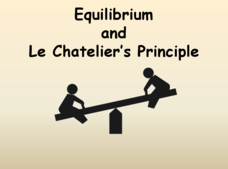
Equilibrium and Le Chatelier's Principle
Time to shake up the status quo with a presentation that describes Le Chatlier's Principle and has pupils examine situations in which equilibrium is upset. Four examples show different stresses to the reaction and the resulting shift.
EngageNY
Sampling Variability in the Sample Proportion (part 1)
Increase your sample and increase your accuracy! Scholars complete an activity that compares sample size to variability in results. Learners realize that the greater the sample size, the smaller the range in the distribution of sample...
EngageNY
Margin of Error When Estimating a Population Mean (part 1)
We know that sample data varies — it's time to quantify that variability! After calculating a sample mean, pupils calculate the margin of error. They repeat the process with a greater number of sample means and compare the results.
EngageNY
Vectors in the Coordinate Plane
Examine the meaning and purpose of vectors. Use the lesson to teach your classes how find the magnitude of a vector and what it represents graphically. Your pupils will also combine vectors to find a resultant vector and interpret its...
EngageNY
Magnitude
Build an understanding of the powers of 10. Pupils investigate the results of raising 10 to positive and negative powers. They relate this understanding to the magnitude these powers represent in this seventh lesson of 15.
Cornell University
Sun or Water? or Both?
Over the course of 10 days, young scientists observe their cups of seed and soil—one that gets sun and water and one that gets no sun and only water. Then they reflect on the results of the experiment to determine if their hypothesis was...
Cornell Lab of Ornithology
Investigating Evidence
Explore the scientific process through nature. Scholars become scientists as they develop a question, design an experiment, collect data, and analyze their results. A two-week lesson guides your classes through the process and provides...
Concord Consortium
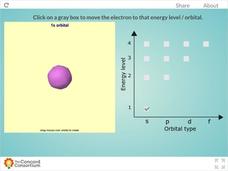
Energy Levels of a Hydrogen Atom
Tired of blowing up countless balloons to illustrate orbital shapes around an atom? Give your lungs a break and use an interactive instead! Learners observe s, p, d, and f orbitals through the first four energy levels using hydrogen as a...
Concord Consortium
Dissolving Experimental
Why does like dissolve like? While in many cases opposites attract, the same cannot be said for chemistry! Solution scholars take an up-close look at the dissolving process with a customizable interactive. The resource allows users to...
Royal Society of Chemistry
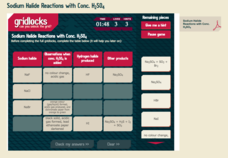
Sodium Halide Reactions with Conc. H2SO4
What do you get when you combine precipitate reactions with puzzles? Maximize the engagement in a single replacement reactions lesson by incorporating fun puzzles. Chemistry scholars observe the reaction between several sodium halides...
Annenberg Foundation
Geometry 3D Shapes: Platonic Solids
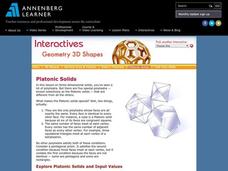
From polyhedrons to platonic solids, here is a lesson that will have your classes talking! As an introduction to platonic solids, scholars cut and fold nets to create the three-dimensional solids. They use an interactive component to...
Kenan Fellows
Man vs. Beast: Approximating Derivatives using Human and Animal Movement
What does dropping a ball look like as a graph? An engaging activity asks learners to record a video of dropping a ball and uploading the video to software for analysis. They compare the position of the ball to time and calculate the...
Project Maths
Probability and Relative Frequency
It's all relatively simple once you get the gist. Young mathematicians learn about sample spaces and simple probability by conducting an activity with dice. To complete the second of six parts in the Statistics and Probability unit, they...
Concord Consortium
Function Project
What if a coordinate plane becomes a slope-intercept plane? What does the graph of a linear function look like? Learners explore these questions by graphing the y-intercept of a linear equation as a function of its slope. The result is a...
Science Matters
Conductors and Insulators
Get that energy flowing while classes study conductors and insulators. Using a simple circuit, learners test different materials to determine the strength of conductivity. They use their results to classify materials as conductors or...
Purdue University
Take-a-Hike
Learn about nature and health all in one set of lessons. Individuals use a scavenger hunt to record observations during a nature hike. They then complete activities to categorize their observations and rate the health of the habitat for...
Radford University
AFDA Probability and Law of Large Numbers
The more trials scholars perform, the closer they'll likely be to the true value. After designing a probability experiment, young mathematicians conduct the experiment for five different numbers of trials. They then analyze the results,...
Museum of Science
Egg Bungee
Think bungee jumping looks scary? Knowing the science behind bungee jumping might make it less so. Using an egg and rubber bands, young engineers model bungee jumping. They test the distances that the egg falls for different numbers of...
University of Colorado
A Spectral Mystery
It's no mystery that every gas has an emission spectrum. Scholars use a spectrograph to look at the emission spectra of nitrogen, oxygen, air, and other gases in gas discharge tubes. They use their results to determine the identity of a...
American Chemical Society
Different Substances React Differently
Looks don't tell the whole story. Young experimenters explore reactions with substances that look similar. They observe the reactions that take place when combined with baking soda and use indicators to conclude they react differently...
American Chemical Society
Mixing Liquids to Identify an Unknown Liquid
Yellow and blue make green in a colorful lesson on liquid solutions. The seventh installment of a 16-part Inquiry to Action series asks pupils to mix different-colored solutions and record their observations. They then use their...
American Chemical Society
Dissolving is a Property
Believe it or not, it is possible for liquids and solids to get along! A hands-on instructional activity has individuals explore dissolving properties of candies in water. They complete an activity guide to record observations about...
Bonneville
Making Observations and Recording Data for Solar Powered Water Pumping
Get pumped about an activity with water pumps. The fifth of seven installments in the Understanding Science and Engineering unit has pupils learn how to make observations, record data, and create data displays. Each group measures the...


