Concord Consortium
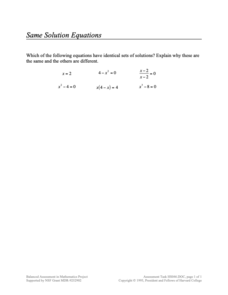
Same Solution Equations
Group equations by their solutions. Given six different equations, pupils determine which have the same solutions. Scholars explain why some are the same and some are different.
Concord Consortium
An Algebraic Oversight
Tackle a common misconception using a performance task. Dividing by a variable to eliminate a variable may seem like a good idea, but simplifying the variable eliminates solutions as well. Learners develop algebraic and graphical support...
Concord Consortium
Quadratic Reflections
Reflect upon the graphs of quadratic functions. Given a quadratic function to graph, pupils determine whether the graph after a horizontal and vertical reflection is still a function. The final two questions ask scholars to describe a...
Concord Consortium
Broken Spreadsheet I
There is power in spreadsheet formulas and learners use this power to model quadratic data. Given a scatterplot of a parabola, pupils create formulas in a spreadsheet to populate the data. The formulas they use lead to an understanding...
Balanced Assessment
Two Solutions
An assessment presents a variety of equations and inequalities. Pupils must find two solutions for each equation or inequality and determine whether there are only two, another finite number, or an infinite number of solutions for the...
Concord Consortium
In a Triangle
What's in a triangle? Just 180 degrees worth of angles! Young learners use given angle relationships in a triangle to write an algebraic representation. Using a system of equations, they simplify the equation to a linear representation.
Concord Consortium
Intersections I
One, two, or zero solutions—quadratic systems have a variety of solution possibilities. Using the parent function and the standard form of the function, learners describe the values of a, b, and c that produce each solution type. They...
Balanced Assessment
Transformation I
Rewriting expressions in different forms is an essential algebra skill. Support the development of this skill by using a task that asks scholars to begin with a linear, quadratic, and rational expression and then manipulate them into a...
Concord Consortium
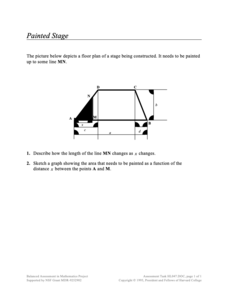
Painted Stage
Find the area as it slides. Pupils derive an equation to find the painted area of a section of a trapezoidal-shaped stage The section depends upon the sliding distance the edge of the painted section is from a vertex of the trapezoid....
Concord Consortium
Betweenness II
Read between the curves ... quadratic curves! Young scholars analyze the graphs of two quadratic functions by writing their own function whose outputs are between the two given. They then consider intersecting quadratic functions and...
Concord Consortium
Systematic Solution I
Writing a general rule to model a specific pattern is a high-level skill. Your classes practice the important skill as they write rules describing the solutions to a system of equations with variable coefficients. As an added challenge,...
Balanced Assessment
Number Game
It's all in the numbers! Create a mathematical model to analyze a number game and develop a winning strategy. Using a given numerical pattern, scholars write an expression to model the scenario. They then interpret the pattern of the...
Concord Consortium
Look but Do Not Touch
We seem to keep missing each other. A short task provides pupils with a quadratic function, as well as a linear function with a missing coefficient. They must determine the value of the coefficient for which the graphs do not intersect.
Illustrative Mathematics
Modeling London's Population
Looking at London's population from 1801–1961 in 20 year increments, high school mathematicians determine if the data can be modeled by a given logistic growth equation. They explain their thinking and determine the values of each...
Concord Consortium
Gravity
Weight is a function of the distance from sea level. Learners explore the many implications of this fact in an inquiry-based task. Given the function, pupils answer questions before manipulating the function to rewrite the distance from...
Concord Consortium
Betweenness III
Don't let a little challenge get between your pupils and their learning! Scholars compare two absolute value functions to recognize patterns and use them to build their own functions with outputs that are between the given. They then...
EngageNY
Relationships Between Two Numerical Variables
Working in small groups and in pairs, classmates build an understanding of what types of relationships can be used to model individual scatter plots. The nonlinear scatter plots in this instructional activity on relationships between two...
Concord Consortium
Functions by the Slice
Piece by piece ... dismantling a function can highlight interesting patterns. The task asks learners to slice functions in sections with the same vertical change. They then recreate the graph with these slices positioned horizontally....
Concord Consortium
Writing and Sketching I
Writing and sketching functions—what more could you want to do? Learners write and sketch functions that meet certain conditions as they complete a short task. They find a parabola that encompasses three quadrants of the coordinate plane...
EngageNY
Relationships Between Two Numerical Variables
Is there another way to view whether the data is linear or not? Class members work alone and in pairs to create scatter plots in order to determine whether there is a linear pattern or not. The exit ticket provides a quick way to...


