Hi, what do you want to do?
Los Angeles County Office of Education
Assessment For The California Mathematics Standards Grade 6
Test your scholars' knowledge of a multitude of concepts with an assessment aligned to the California math standards. Using the exam, class members show what they know about the four operations, positive and negative numbers, statistics...
Inside Mathematics
Population
Population density, it is not all that it is plotted to be. Pupils analyze a scatter plot of population versus area for some of the states in the US. The class members respond to eight questions about the graph, specific points and...
Mathed Up!
Pie Charts
Representing data is as easy as pie. Class members construct pie charts given a frequency table. Individuals then determine the size of the angles needed for each sector and interpret the size of sectors within the context of frequency....
Inside Mathematics
Snakes
Get a line on the snakes. The assessment task requires the class to determine the species of unknown snakes based upon collected data. Individuals analyze two scatter plots and determine the most likely species for five...
Inside Mathematics
House Prices
Mortgages, payments, and wages correlate with each other. The short assessment presents scatter plots for young mathematicians to interpret. Class members interpret the scatter plots of price versus payment and wage versus payment for...
Los Angeles County Office of Education
Assessment For The California Mathematics Standards Grade 4
Have scholars show what they know with a 20-page assessment aligned to the California State Standards. The test covers concepts such as large and whole numbers, all four mathematical operations, fractions, decimals, geometric figures,...
Balanced Assessment
Survey Says
Examine statistical data that shows an overlap in responses. The data tallies over 100% and learners interpret this data characteristic. They then create a graph to represent the data.
Inside Mathematics
Scatter Diagram
It is positive that how one performs on the first test relates to their performance on the second test. The three-question assessment has class members read and analyze a scatter plot of test scores. They must determine whether...
Mathed Up!
Frequency Polygons
Frequency polygons are a different way to represent frequencies over intervals. Pupils take frequencies for intervals of data from a frequency table and plot them as a frequency polygon. Budding mathematicians find information about the...
Inside Mathematics
Archery
Put the better archer in a box. The performance task has pupils compare the performance of two archers using box-and-whisker plots. The resource includes sample responses that are useful in comparing individuals' work to others.
Noyce Foundation
Ducklings
The class gets their mean and median all in a row with an assessment task that uses a population of ducklings to work with data displays and measures of central tendency. Pupils create a frequency chart and calculate the mean and median....
Inside Mathematics
Marble Game
Pupils determine the theoretical probability of winning a game of marbles. Individuals compare the theoretical probability to experimental probability for the same game. They continue on to compare two different probability games.
Inside Mathematics
Conference Tables
Pupils analyze a pattern of conference tables to determine the number of tables needed and the number of people that can be seated for a given size. Individuals develop general formulas for the two growing number patterns and...
Illustrative Mathematics
Do You Fit In This Car?
A short activity that focuses on the normal distribution as a model for data distribution. Using given means and standard deviations, your budding statisticians can use statistical tables, calculators, or other statistical software to...
Achieve
Ground Beef
Ever wonder how a butcher creates the different types of ground beef? Young mathematicians explore the methods butchers use to create their desired ground beef quality. Given a combination of two types of meat with varying...
Math Drills
Math Drills: Statistics and Probability Worksheets
Download these free worksheets to sharpen your skills with statistics and probability. Sheets focus on collecting and organizing data, measures of central tendency (mean, median, mode, and range), and probability.
PBS
Pbs Lesson Plan: Chances Are Talking Probability (Pdf) [Pdf]
An introductory lesson in probability for students in grades three to five. The concepts presented in this lesson are interwoven, over time, into a current unit of study. Students examine closely the "language" of probability as used in...
Khan Academy
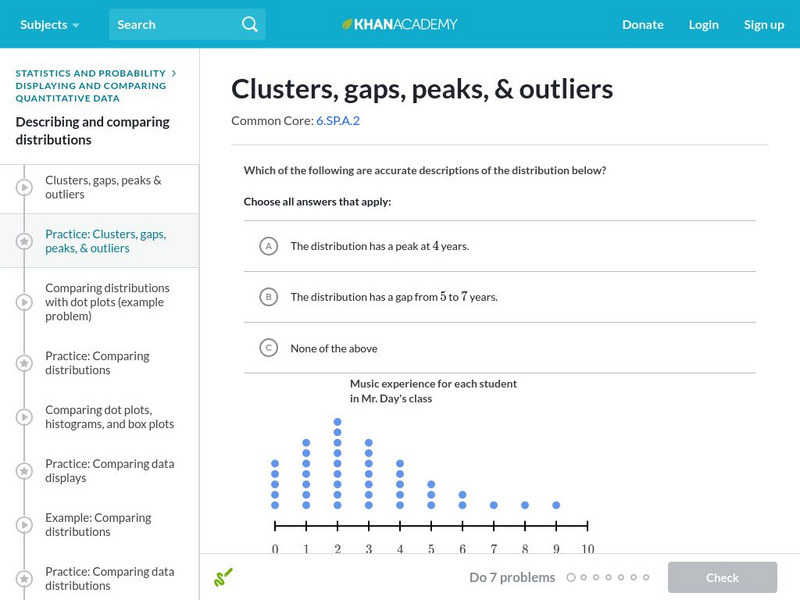
Khan Academy: Clusters, Gaps, Peaks, and Outliers
In this exercise, students practice describing data distributions as clusters, gaps, peaks, and outliers. Students receive immediate feedback and have the opportunity to get hints and try questions repeatedly.
Oswego City School District
Regents Exam Prep Center: Statistical Studies, Central Tendency, and Dispersion
The mathematics tutorial investigates statistical studies, central tendency, and dispersion. The lesson consists of class notes, calculator tips, examples, and practice problems with solutions. The teacher resource includes an activity...
Soft Schools
Soft Schools: Probability and Statistics Quiz
Students are asked to find the mean, median, mode, and range of a data set. Also, they must be able to interpret graphs and tables, and graphically represent data. The quiz is multiple choice and consists of nine questions, and a summary...
Other
Ohio Department of Education: Fifth Grade Achievement Test (Practice Test) [Pdf]
Half-length practice test for the third grade OAT (Ohio Achievement Test). The test includes 17 multiple-choice and 3 open-response question dealing with topics such as measurement (unit conversion, time), geometry (volume, area), data...
Khan Academy
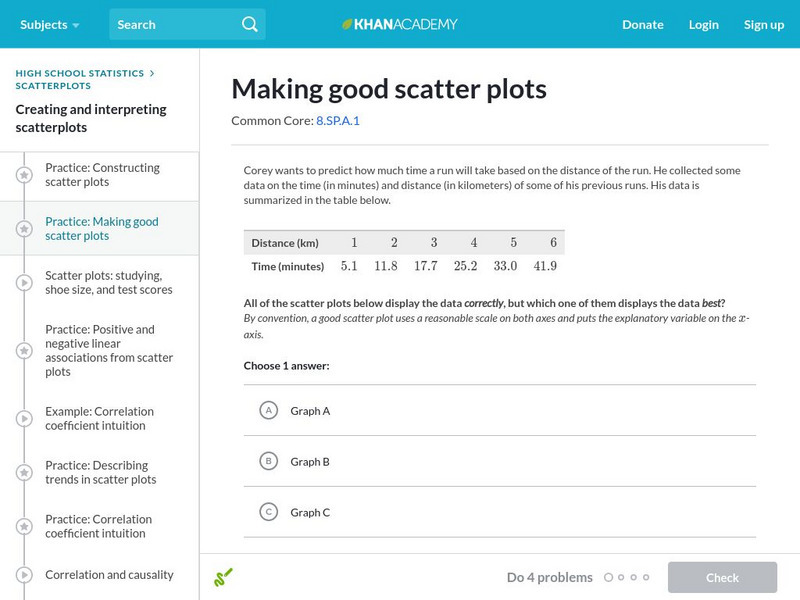
Khan Academy: Making Good Scatter Plots
A good scatter plot has the independent variable on the x-axis and the dependent variable on the y-axis. Also, the scale of both axes should be reasonable, making the data as easy to read as possible. In these practice problems, we...
Other
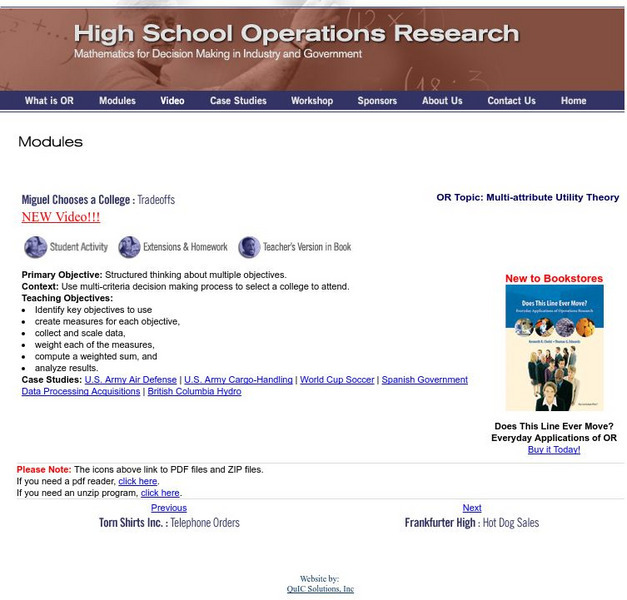
Hsor.org: Miguel Chooses a College: Tradeoffs
Use several strategies and criteria to help Miguel determine the college for him.
Other
Ode: Seventh Grade Achievement Test (Practice Test) [Pdf]
Half-length practice test for the third grade OAT (Ohio Achievement Test). The test includes 17 multiple-choice and 4 open-response questions dealing with topics such as number sense (order of operations, ratios), measurement (metric...


