Fluence Learning
Writing About Informational Text: Music and the Brain
Even if you've never picked up a musical instrument, chances are that music has directly impacted your mental and emotional development. Sixth graders engage in a reading activity in which they read two articles on the impact of music on...
Curated OER
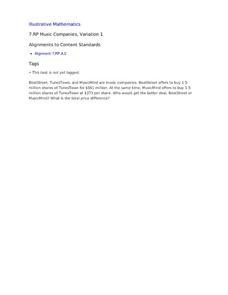
7.RP Music Companies, Variation 1
We've got the beat! And your musically-minded mathematicians will tap their toes as they determine which music company would be getting a better deal based on their offers to buy out TunesTown. The topic is extended in an additional task...
Curated OER
Music and Sports
With so much talent in the classroom, do your musicians and athletes have related interests? This problem has your learners taking data from their classmates to decide whether there is an association between the two activities. The...
EngageNY
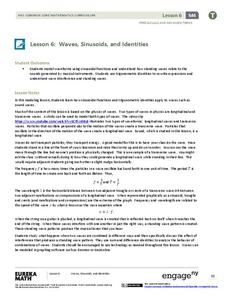
Waves, Sinusoids, and Identities
What is the net effect when two waves interfere with each other? The lesson plan answers this question by helping the class visualize waves through graphing. Pupils graph individual waves and determine the effect of the interference...
Curated OER
Homonyms-Quiz 30
Students determine the correct homonym to use in a sentence. In this homonym lesson, students take an online quiz. They read a sentence and choose the correct homonym from a list. Students can click to see the correct answer.
Mathed Up!
Pie Charts
Representing data is as easy as pie. Class members construct pie charts given a frequency table. Individuals then determine the size of the angles needed for each sector and interpret the size of sectors within the context of frequency....
Concord Consortium
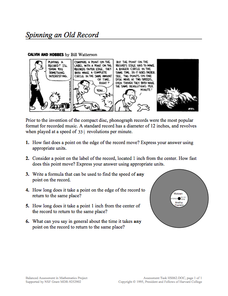
Spinning an Old Record
Take a trip back in time to examine angular velocity. Using the revolutions per minute, learners calculate the speed of a point on a 33 record. They compare the speed of a point on the edge of the record to the speed of a point closer to...
EngageNY
Displaying a Data Distribution
Pupils analyze a display of data and review dot plots to make general observations about the highest, lowest, common, and the center of the data. To finish, learners match dot plots to scenarios.
Other popular searches
- Elementary Music Lesson
- Lesson Plans Music Teachers
- Art and Music Lesson
- Christmas Music Lesson Plans
- Music Theory Lesson Plans
- Blues Music Lesson Plans
- Music Movement Lesson Plans
- Film Music Lesson
- Childrens Music Lesson Plans
- Jazz Music Lesson Plans
- Medieval Music Lesson Plans
- Arts Music Lesson Plans


