Howard Hughes Medical Institute
Population Dynamics
Will human population growth always be exponential, or will we find a limiting factor we can't avoid? Young scientists learn about both exponential and logistic growth models in various animal populations. They use case studies to...
US Department of Commerce
Featured Activity: Population Change Over Time
Keep track of a state's population. After a brief discussion on how population data is used for funding, individuals look at population changes over time. Pupils find the population of two states using three different censuses. They then...
Curated OER
Modeling Population Growth
Young scholars create linear, exponential, and quadratic models of U.S. population data to determine which function best represents U.S. population growth. They predict future populations based on each model.
PBS
Population Simulation with M&M's
Math and M&Ms® go great together when introducing a modeling activity. Allow your learners to simulate population growth and decay of fish in a pond and share their reasoning for the change in fish. With such an impact we have on our...
Curated OER
Population Growth
High schoolers calculate human emission rate by year 2050. For this social studies lesson, students watch a video online and analyze population trends. They explain how e total emissions affect global climate.
Curated OER
Horizontal Bar Graph: Changes in Nebraska Population
In this bar graph worksheet, students learn about the changes in Nebraska's population from 1880 to 2000 by studying a bar graph. Students answer 7 questions about the graph.
Curated OER
Population Pyramids
High schoolers engage in a lesson that is about the concept of measuring the statistical data of a population taken from a census. The data is interpreted and recorded looking for trends in subjects like world economy and job opportunities.
Shodor Education Foundation
Rabbits and Wolves
A change in a parameter can end in overpopulation. The resources gives pupils the opportunity to control the parameters of rabbits and wolves in a natural setting. Using the set parameters, the simulation runs and displays the population...
Concord Consortium
People and Places
Graph growth in the US. Given population and area data for the United States for a period of 200 years, class members create graphs to interpret the growth over time. Graphs include population, area, population density, and population...
Shodor Education Foundation
Spread of Disease
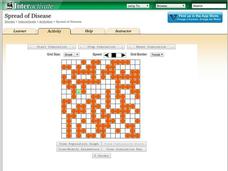
Control the spread of a contagious disease. An applet allows pupils to run a simulation on the spread of a disease. Rules govern how the disease is spread and the length of time it takes to recover. Learners view the spread visually and...
Curated OER
Population Counts
Students investigate the analytical processes used to interpret the 2001 Canadian census. They examine the population statistics and trends.
Curated OER
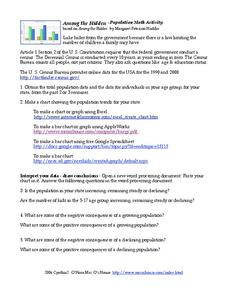
Among the Hidden - Population Math Activity
In this population worksheet, students collect data on population by researching the Census Bureau and then make online graphs and answer short answer questions about the data. Students complete 5 problems total.
Curated OER
All Choked Up By Smoking Statistics
Scholars use the article "More College High schoolers Are Smoking, Study Says" as a springboard for discussion on the reasons why people smoke cigarettes. They investigate different methods of graphing statistics by using the data...
Curated OER
The Correlation Between Human Population Growth and Dwindling Natural Resources
Eighth graders predict human population growth. In this lesson plan, 8th graders discuss the length of time needed to double the human population, work in groups to chart population growth and predict population growth in the...
Curated OER
Population Pyramids
Students create a population pyramid based on current data for their final project country. They analyze data from comprehension trends of final project country. Students analyze populations of specific countries.
Curated OER
How Many Is Too Many?
Students explore the population explosion. They view a video depicting the exponential growth of human population. Students research the internet to project future population data. They perform hands-on, multimedia activities to study...
Curated OER
Population Pyramids
Students utilize population pyramids to answer questions, make comparisons, draw conclusions and support predictions about the populations of China, India and the Unites States. They arrange numbers and symbolic information from various...
Curated OER
World in the Balance
Learners make estimates on how many people they believe live on Earth. While watching a video, they take notes on the issues facing Kenya, Japan and India. In groups, they calculate how long it takes for a country to double in size. To...
Curated OER
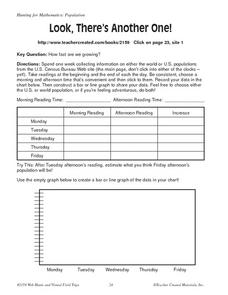
Look, There's Another One!
In this math worksheet, students spend a week collecting information on either the word or U.S. populations from the U.S. Census Bureau Web site. Students record their data in a chart and bar graph. Students also use the website to...
CCSS Math Activities
Smarter Balanced Sample Items: 7th Grade Math – Target H
Not one but two box plots. How will your pupils fare? Assess their understanding of box plots by having them compare two populations. The eighth of nine installments in the Gr. 7 Claim 1 Item Slide Shows series, the resource has them...
Curated OER
Scatter Plots
In this scatter plots worksheet, learners solve and complete 4 different problems. First, they use the table shown to model the relation with a scatter plot and trend line and to predict the value of a variable when given the other...
Curated OER
Population Counts
Pupils role play as news teams as they investigate population information from 2001 Canadian census. They study statistical information and produce a news story.
National Council of Teachers of Mathematics
Rough Rule
For this algebra activity, learners estimate the Canadian population using the rough rule. There are two questions.
Shodor Education Foundation
Life
How does life evolve? The interactive provides a simulation based on the Game of Life invented by mathematician John Conway. Users can run the applet with the preset rules and settings or adjust them to view whether overpopulation or...


