PBS
Population Simulation with M&M's
Math and M&Ms® go great together when introducing a modeling activity. Allow your learners to simulate population growth and decay of fish in a pond and share their reasoning for the change in fish. With such an impact we have on our...
It's About Time
Factors Affecting Population Size
How do we predict future population growth? Young researchers investigate various factors affecting the size of our population. As they calculate and interpret graphs to determine factors that could potentially affect increases...
Illustrative Mathematics
Logistic Growth Model, Abstract Version
Here learners get to flex some serious algebraic muscles through an investigation of logistic growth. The properties of the constant terms in the logistic growth formula are unraveled in a short but content-dense...
US Department of Commerce
Featured Activity: Population Change Over Time
Keep track of a state's population. After a brief discussion on how population data is used for funding, individuals look at population changes over time. Pupils find the population of two states using three different censuses. They then...
PBS
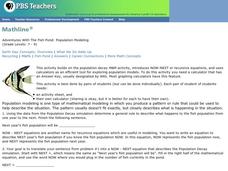
Adventures With The Fish Pond: Population Modeling
Build up from the previous activity where your learners charted the population growth and decay of a fish pond with M&Ms®. Have them look at the data from that activity and create a Now-Next, or recursive equations, to predict the...
Firelands Local Schools
Exponential Growth and Decay
How can you safely model exponential growth and decay? A hands-on activity uses candies to model not only exponential decay, but also exponential growth. Exponential equations are fitted by hand and by use of a calculator...
Curated OER
Bacteria Populations
Your young microbiologists will interpret and solve exponential equations in this real-world context task set in a hospital research scenario. Learners think in terms of the functions as well as their rates of change.
Curated OER
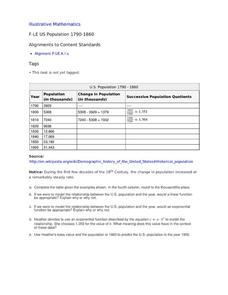
US Population 1790-1860
Your young population scientists analyze a table of values, write a model to represent the real life data, finish the table of data and predict future populations in a collaborative, real-life activity.
Curated OER
In the Billions and Exponential Modeling
Modeling population growth gives learners an opportunity to experiment with real data. Comparing the growth rates in this real-life task strengthens learners' understanding that exponential functions change by equal factors over equal...
US Department of Commerce
Community Change
America is a country on the move. Analyzing data from the Census Bureau, class members gauge the people moving in and out of their areas. An interactive web feature allows pupils to see who is moving out and moving in, while discussion...
Agile Mind
Rabbit populations
In this real-world problem about the rapid growth of rabbit populations, students must analyze two different scenarios and create mathematical models to represent them. They use their exponential models to answer questions about the...
Teach Engineering
Computer Simulation of the Sonoran Desert Community
See how changes in initial populations and parameters affect a biological community. Individuals use a special software program to simulate a desert community with five species. They adjust initial populations to see how the community...
Curated OER
US Population 1982-1988
Your algebra learners make predictions using the concepts of a linear model from real-life data given in table form. Learners analyze and discuss solutions without having to write a linear equation.
Curated OER
In the Billions and Linear Modeling
Your learners analyze population data to discern if it best fits a linear scenario. The idea of change by equal differences over equal intervals is enforced in this real-life task.
Curated OER
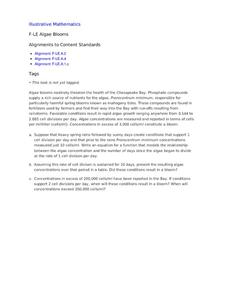
Algae Blooms
Your microbiologists explore a changing algae population and build an exponential function modeling algae concentration from the description given of the relationship between concentrations in cells/ml and days of rapid growth.
Federal Reserve Bank
FRED in the Classroom: Employment and the Labor Force
Acquaint your class members with data sources for employment in the United States and help them gain a better understanding of a vital measure of our economy's health.
NOAA
Your Own El Nino
Scholars make a model to discover how the force of trade winds over the Pacific Ocean creates an El Niño. Super scientists observe how the severe weather affects life in water and on land.
TeachEngineering
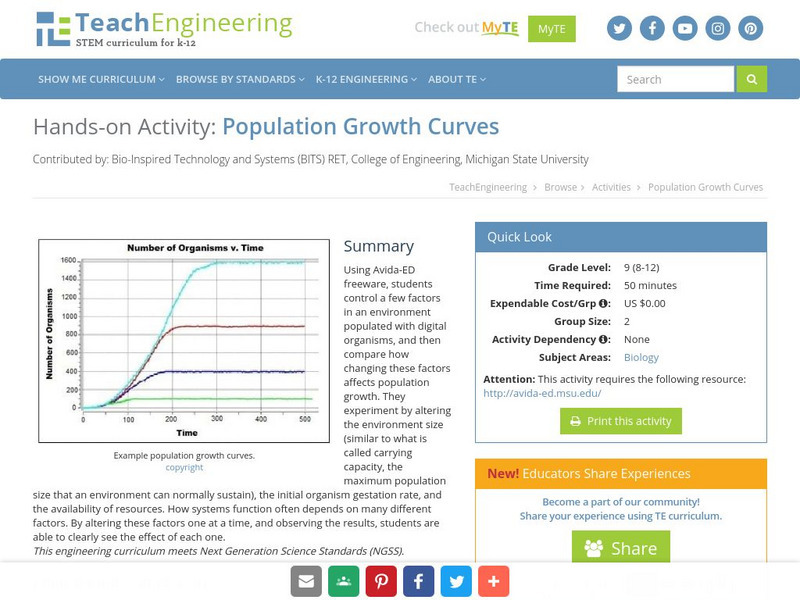
Teach Engineering: Population Growth Curves
Using Avida-ED freeware, students control a few factors in an environment populated with digital organisms, and then compare how changing these factors affects population growth. They experiment by altering the environment size (similar...
Texas Instruments
Texas Instruments: Math Today Population on the Move
In this activity students will determine the rate of change (slope) & build a linear model (y = mx + b) from this data. The model will be used to make a prediction about the future growth of the population of the U.S. if the current...
Khan Academy
Khan Academy: Activity: This Threshold Today
Use the Internet to search for news stories about the Modern Revolution and discuss the provided questions. Helpful links are provided to get you started.
Texas Instruments
Texas Instruments: Math Today for Ti Navigator System More of u.s.
Using the USA TODAY Snapshot, "More of U.S.," students will learn how to interpret data presented in a graphical form. Students will determine the rate of change (slope) and build a linear model (y = mx + b) from this data. The model...


