Mathed Up!
Using a Calculator
Here's a video that presents several numerical expressions to be evaluated using a calculator.Viewers come to realize that sometimes it is not just a matter of punching in the numbers, but they also need to be concerned about how...
Concord Consortium
Calculator Numbers
Know thy calculator. Young mathematicians use their calculators to answer a set of questions. They consider how the number of digits the calculator displays affects the answers to calculations. They then find examples of computations...
EngageNY
Calculating Probabilities of Compound Events
Use tree diagrams with multiple branches to calculate the probabilities of compound events. Pupils use tree diagrams to find the sample space for probability problems and use them to determine the probability of compound events in the...
EngageNY
Solving Area Problems Using Scale Drawings
Calculate the areas of scale drawings until a more efficient method emerges. Pupils find the relationship between the scale factor of a scale drawing and the scale of the areas. They determine the scale of the areas is the square of the...
Mathed Up!
Functional Maths Questions
Dang, it's a word problem! Pupils address a variety of word problems that involve knowledge of proportions and geometric topics. The General Certificate of Secondary Education review problems require determining costs based on area...
CCSS Math Activities
Smarter Balanced Sample Items: High School Math – Target C
Let units pave the way to success. A set of five questions in a helpful PowerPoint presentation highlights the SBAC Claim 1 Target C high school item specifications. It covers the use of units to steer solutions, identifying appropriate...
CCSS Math Activities
Smarter Balanced Sample Items: 8th Grade Math – Claim 4
A math model is a good model. A slide show presents 10 sample items on modeling and data analysis. Items from Smarter Balanced illustrate different ways that Claim 4 may be assessed on the 8th grade math assessment. The presentation is...
CCSS Math Activities
Smarter Balanced Sample Items: 8th Grade Math – Claim 2
Math can be a problem in eighth grade. Sample items show how problem solving exists within the eighth grade standards. Part of the Gr. 8 Claim 2 - 4 Item Slide Shows series, the presentation contains eight items to illustrate the...
Illustrative Mathematics
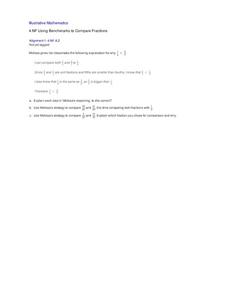
Using Benchmarks to Compare Fractions
Introduce a new strategy for comparing fractions by analyzing Melissa's use of benchmarks. Walk the class through her process, calling on students to explain their understanding of each step she took. Then practice this method on two...
EngageNY
Systems of Equations Leading to Pythagorean Triples
Find Pythagorean Triples like the ancient Babylonians. The resource presents the concept of Pythagorean Triples. It provides the system of equations the Babylonians used to calculate Pythagorean Triples more than 4,000 years ago. Pupils...
Curated OER
Performance-Based Assessment Practice Test (Grade 6 Math)
Keep track of your sixth graders' mastery of the Common Core math standards with this practice assessment. Taking a different approach than most standardized tests, this resource includes not only multiple choice questions, but also...
CCSS Math Activities
Smarter Balanced Sample Items: 8th Grade Math – Target H
Pythagoras is all about being right. A presentation provides sample items for how the Pythagorean Theorem standards may show up in Smarter Balanced assessments. Seven items use the Pythagorean Theorem to find the sides of a right...
EngageNY
Using Tree Diagrams to Represent a Sample Space and to Calculate Probabilities
Cultivate the tree of knowledge using diagrams with two stages. Pupils create small tree diagrams to determine the sample space in compound probability problems. The lesson uses only two decision points to introduce tree diagrams.
EngageNY
Describing Distributions Using the Mean and MAD
What city has the most consistent temperatures? Pupils use the mean and mean absolute deviation to describe various data sets including the average temperature in several cities. The 10th lesson in the 22-part series asks learners to...
EngageNY
Using Sample Data to Compare the Means of Two or More Populations II
The 23rd segment in a series of 25 presents random samples from two populations to determine whether there is a difference. Groups determine whether they believe there is a difference between the two populations and later use an...
EngageNY
Describing Variability Using the Interquartile Range (IQR)
The 13th activity in a unit of 22 introduces the concept of the interquartile range (IQR). Class members learn to determine the interquartile range, interpret within the context of the data, and finish by finding the IQR using an...
Charleston School District
Review Unit 3: Functions
Time to show what you know about functions! The review concludes a series of nine lessons on the basics of functions. The problems included are modeled from the previous lessons. Pupils determine if a table represents a function,...
Charleston School District
Pre-Test Unit 4: Linear Funcitons
Let your classes show you what they know! Use this pre-test to assess the current knowledge of your learners. The assessment includes all pre-algebra concepts related to functions: writing and graphing linear relationships, comparing...
Illustrative Mathematics
Calculating and Rounding Numbers
Mathematicians need to know that not all numbers are rational. We approximate irrational number with rational numbers. That is why a calculator may be misleading. This task give learners an opportunity to see how rounding a number and...
EngageNY
The Converse of the Pythagorean Theorem
Is it a right triangle or not? Introduce scholars to the converse of the Pythagorean Theorem with a lesson plan that also provides a proof by contradiction of the converse. Pupils use the converse to determine whether triangles with...
Illustrative Mathematics
Solar Eclipse
Learners take on the role of astronomers, calculating conditions necessary for a total solar eclipse. Concepts of similar triangles and properties of circles come together as pupils create ratios and use real measurements in determining...
EngageNY
Another Computational Model of Solving a Linear System
The process of elimination really works! Use elimination when substitution isn't doing the job. The 29th segment in a series of 33 introduces the elimination method to solving linear systems. Pupils work several exercises to grasp the...
EngageNY
Modeling a Context from Data (part 2)
Forgive me, I regress. Building upon previous modeling activities, the class examines models using the regression function on a graphing calculator. They use the modeling process to interpret the context and to make predictions...
EngageNY
Problem Solving Using Rates, Unit Rates, and Conversions
Find a way to work with rates. The 23rd part in a 29-part series presents work problems for the class to solve given work rates. Pupils compare rates to determine which is faster. Some problems require learners to convert the rates to...
