Shmoop
Box, Stem-Leaf, and Histogram
A helpful and versatile activity requires young mathematicians to analyze data in order to create graphs and answer questions. Additionally, it prompts learners to find the mean, median, mode, and range of some of the data sets.
PBS
Working with Coordinate Planes: Activities and Supplemental Materials
Seven activities make up a collection of supplemental materials to reinforce graphing on a coordinate plane. Worksheet objectives include plotting coordinates within single and four quadrants, measuring straight and...
Balanced Assessment
Books from Andonov
To examine mathematical functions in a modeling situation pupils combine quadratic and step functions to represent a presented scenario. They both graph and write a function to represent data shown in a table.
Mt. San Antonio Collage
Quiz 2: Polynomials
Four questions that get right to the polynomial point. High schoolers list all the attributes of a polynomial function, including finding all complex zeros. The last two questions prompt them to write a function based on the given...
Curated OER
Systems of Equations and Inequalities
This is a comprehensive lesson on creating and solving equations and systems of equations and inequalities. Problems range from basic linear equations to more complex systems of equations and inequalities based on a real-world examples....
Los Angeles County Office of Education
Assessment for the California Mathematics Standards Grade 5
Test young mathematicians' knowledge with an assessment aligned to California's fifth grade state standards. The exam covers a multitude of concepts including fractions and decimals, positive and negative numbers, measurement; and...
Illustrative Mathematics
Invertible or Not?
Two for one—create an invertible and non-invertible function from the same data. The task presents a function table with missing outputs for the class to use to create two functions. One of the functions should have an inverse while the...
Mathed Up!
Tallys and Charts
After watching a brief instructional video, young mathematicians are put to the test. By completing and reading frequency tables, tally charts, and bar graphs, individuals show their understanding of how to interpret data.
Achieve
Rabbit Food
Keep your pets slim, trim, and healthy using mathematics! Pupils use a linear programming model to optimize the amount and type of food to provide to a pet rabbit. They model constraints by graphing inequalities and use them to analyze a...
Curated OER
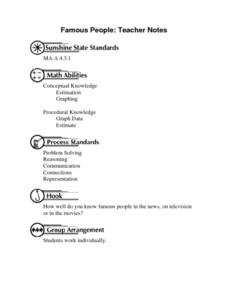
Famous People: Teacher Notes
Young statisticians practice creating scatter plots. First, they estimate the age of 14 people. Next, they write down the estimate in a table labeled x. Then write down their actual age in the table labeled y. Using these x and y...
West Contra Costa Unified School District
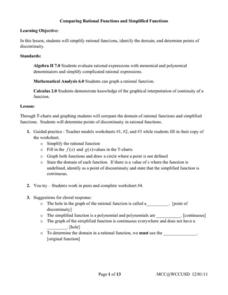
Comparing Rational Functions and Simplified Functions
What kind of functions have holes in their graphs? Here, the teacher guides the class on how to use the simplified function of a rational function to aid in the graphing of the original rational function. T-tables are used in order...
EngageNY
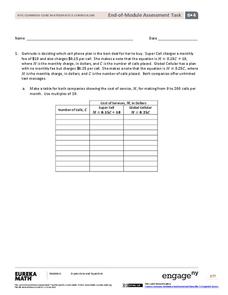
End-of-Module Assessment Task: Grade 6 Math Module 4
Finish out the module with a bang. The last installment of a 36-part module is an end-of-module assessment task. Test takers set up equations to represent relationships and solve problems in an assortment of contexts.
Curated OER
Converting Units Of Length
Use this converting units of length worksheet to have your charges fill out a table, find the perimeters to three shapes and calculate the answers to three word problems.
Curated OER
Food chains at sea
Fifth graders interpret a table of data about food chains in the ocean. They create a food chain to represent the information on the table. Periwinkles eat seaweed, and crabs eat periwinkles - so who eats crabs? Extend the activity with...
University of Utah
Simultaneous Linear Equations
Solve simultaneous linear equations, otherwise known as systems of linear equations. Pupils practice solving systems of linear equations by graphing, substitution, and elimination. The workbook provides a class activity and homework...
Mathed Up!
Frequency Polygons
Frequency polygons are a different way to represent frequencies over intervals. Pupils take frequencies for intervals of data from a frequency table and plot them as a frequency polygon. Budding mathematicians find information about the...
Statistics Education Web
I Always Feel Like Somebody's Watching Me
Future statisticians and potential psychics first conduct an experiment to collect data on whether a person can tell if someone is staring at them. Statistical methods, such as hypothesis testing, chi-square tests, binomial tests, and...
Mathed Up!
Pie Charts
Representing data is as easy as pie. Class members construct pie charts given a frequency table. Individuals then determine the size of the angles needed for each sector and interpret the size of sectors within the context of frequency....
Illustrative Mathematics
Electoral College
A cross-curricular resource that takes the electoral votes and allows your learners to organize and analyze the data. Young voters can determine which states are more influential and interpret the dotplot provided for more data....
Concord Consortium
King for a Day
Rumor has it exponential functions help solve problems! In a kingdom filled with rumors, young scholars must determine the speed a rumor spreads. The ultimate goal is to decide how many people must know the rumor for it to spread to the...
Curated OER
Tables and Relations
In this tables and relations worksheet, 9th graders solve and complete 13 various types of problems that include graphing. First, they solve each equation for the given variable. Then, students determine the ordered pairs that are...
Curated OER
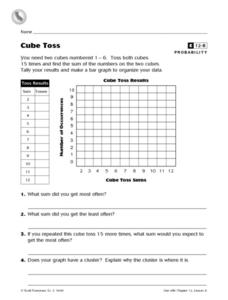
Cube Toss
In this probability and graphing learning exercise, students solve 8 problems in which data from a cube toss is displayed on a table and graph. Students answer the questions about their results.
Curated OER
Chapter 4 Test: Functions and Integers
In this functions and integers instructional activity, students combine positive and negative integers through addition, subtraction, multiplication and division. They complete function tables and graph the results of linear equations....
Curated OER
Using Tables
In this using tables worksheet, 9th graders solve and complete 10 various types of problems that include using tables to determine information. First, they write an equation to determine the total amount. Then, students define each of...


