Illustrative Mathematics
Art Class, Assessment Variation
Play with paint and decide the ratio to make different shades of green. When mixing paint colors, your painters should decide which ratios make the same shade and what is needed to mix other ratios for a different shade of green. This is...
Willow Tree
Bar Graphs
Circles, lines, dots, boxes: graphs come in all shapes in sizes. Scholars learn how to make a bar graph using univariate data. They also analyze data using those bar graphs.
California Education Partners
Summer Olympics
Quickly get to the decimal point. The last assessment in a nine-part series requires scholars to work with decimals. Pupils compare the race times of several athletes and calculate how much they have improved over time. During the second...
Achieve
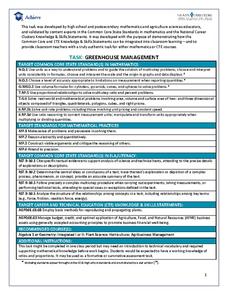
Greenhouse Management
Who knew running a greenhouse required so much math? Amaze future mathematicians and farmers with the amount of unit conversions, ratio and proportional reasoning, and geometric applications involved by having them complete the...
SHS Algebra
Linear vs. Exponential Functions Tasks
Your algebra learners will enjoy the real-life application of the three tasks presented here. They complete a table and a graph comparing the two options presented. One option is linear, while the other is exponential. After coming up...
Balanced Assessment
Cost of Living
Math scholars investigate the cost of living in Hong Kong compared to Chicago but must first convert the different types of currency. They then choose a type of graph to compare different spending categories and finish the activity by...
Curated OER
Topology - The Mathematics of Distortion
In this topology worksheet, 7th graders solve and complete 12 different problems that include shapes and math distortion. First, they use the forms of capital letters as guides, stretch or bend the shape in the first column into as many...
West Contra Costa Unified School District
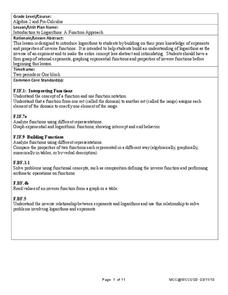
Introduction to Logarithms
Build on pupils' understanding of inverse functions by connecting logarithmic functions to exponential functions. This activity allows individuals to see graphically the inverse relationship between an exponential and logarithmic...
Mathed Up!
Fractions, Decimals, and Percentages
After watching a video on making conversions, young mathematicians solve 16 math problems that involve making conversions of fractions to decimals and percents, decimals to fractions and percents, and percents to fractions and...
Achieve
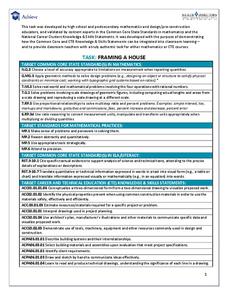
Framing a House
If members of your class wonder where they can use the math they learn in middle school, let them discover the answer. Learners apply geometry concepts of scale and measure to calculate the costs of framing a house addition.
Achieve
Dairy Barn
Agriculture is truly a math-based profession! Help the dairy farmer determine the supplies needed to complete his barn. Using given dimensions, learners build equations and use units to determine the correct amount of materials.
Mathematics Assessment Project
Shelves
Don't leave this task on the shelf — use it is assess middle schoolers understanding of patterns. Participants try to discover a pattern in the number of bricks and planks used to make shelves. They then match descriptions...
Bowland
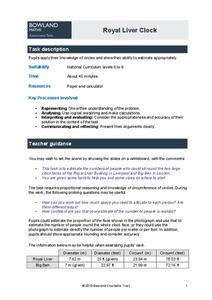
Royal Liver Clock
Using clocks as dining tables? Scholars estimate the number of people that can sit around the face of the clock on the Royal Liver Building in Liverpool. They use estimation to justify their responses.
National External Diploma Program Council
Finding an Average
Young hopefuls can practice finding the average of a group of numbers represented in tables and word problems.
Willow Tree
Line Graphs
Some data just doesn't follow a straight path. Learners use line graphs to represent data that changes over time. They use the graphs to analyze the data and make conclusions.
Illustrative Mathematics
Electoral College
A cross-curricular resource that takes the electoral votes and allows your learners to organize and analyze the data. Young voters can determine which states are more influential and interpret the dotplot provided for more data....
Illustrative Mathematics
Dimes and Quarters
Here is a coin problem where the algebra learner determines the pair of linear equations needed to solve the system. Whether the equations are taken from a table, or your scholars recognize the format of a coin problem, it is an...
West Contra Costa Unified School District
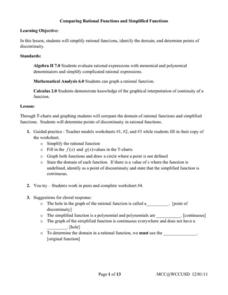
Comparing Rational Functions and Simplified Functions
What kind of functions have holes in their graphs? Here, the teacher guides the class on how to use the simplified function of a rational function to aid in the graphing of the original rational function. T-tables are used in order...
Curated OER
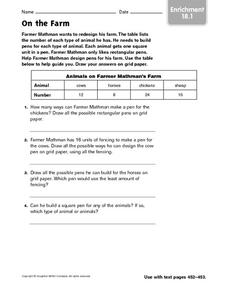
On the Farm - Enrichment 18.1
For this square unit worksheet, students read the word problem about the pens Farmer Mathman wants to build for his animals. Students then use the table to guide them. Students draw their answers on grid paper and then answer the four...
Curated OER
Line Plots - Homework 6.3
Elementary schoolers use data in a table to make a line plot, then answer five related questions. Houghton Mifflin text is referenced.
Mathed Up!
Histograms
Class members explore how to read and use histograms by watching a video on creating and analyzing histograms. To finish, the class works on a set of questions that tests these skills.
Curated OER
Multiplication Table: Facts From 1-12
In this multiplication worksheet, students complete a multiplication table with facts from 1- 12. There are some numbers provided as hints.
Curated OER
Using a Chart or Table
In this charts and tables worksheet, learners follow directions on setting up charts or tables to help them solve time and addition word problems. Students complete 3 problems.
Curated OER
New York State Testing Program Grade 8 Math Sample Test 2005
In this New York state sample test worksheet, 8th graders solve thirty-three sample math problems designed to help students prepare for the grade eight math test. Tips for taking the test are provided.


