Math Worksheets Land
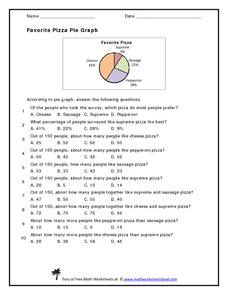
Favorite Pizza Pie Graph
You've heard of a pie graph, but what about a pizza pie graph? Challenge young mathematicians to answer ten questions based on a random survey of people's favorite pizzas. A pie graph displays the percentages of each type of pizza. Some...
Curated OER
Use Google Maps to Teach Math
Capture the engagement of young mathematicians with this upper-elementary math lesson on measuring time and distance. Using Google Maps, students first measure and compare the distance and time it takes to travel between different...
Curated OER
Math On the Job
Investigate different types of math required for specific jobs. In this math in occupations lesson, use the Internet to research what type of math one might need to know in order to be successful in different jobs. Complete a related...
Curated OER
Rhythm, Math, Rhythm
Learners play instruments in math class to learn the interconnectedness between math and music. In this math instructional activity, students subdivide a piece of music, clapping rhythms and charting rhythm patterns in the song. A guided...
Discovery Education
Discovering Math: Exploring Geometry
Apply geometric properties and formulae for surface area and volume by constructing a three-dimensional model of a city. Learners use similar and congruent figures and transformations to create a city of at least 10 buildings. They trade...
Math Worksheets Land
Pie or Circle Graphs—Step-by-Step Lesson
How do you display data that you've collected in a pie chart? Follow a clear step-by-step guide to turning survey results into a visible format. It shows kids how to determine the percentage of the whole that each section represents.
Math Worksheets Land
Pie or Circle Graphs - Guided Lesson
A guided lesson worksheet reinforces pie graph skills using a given set of data. Each problem requires young mathematicians to create a circle graph using five colors, and to provide a key that goes along with the graph.
Balanced Assessment
Movie Survey
Movie preferences will get your classes talking! Individuals read a pie graph and construct a bar graph using the same information. They then answer questions specific to the data and sample size.
Beyond Benign
Municipal Waste Generation
Statistically, waste may become a problem in the future if people do not take action. Using their knowledge of statistics and data representation, pupils take a look at the idea of waste generation. The four-part unit has class members...
Curated OER
Unit 6b -Year 5
If you have some 9-10 year olds who are ready for some 5th year math, then check out this UK math unit. There are 172 slides that cover all of the basic multiplication tables, relate those to division, fractions, sequencing, and an...
Curated OER
100 Chart-Math Helper-Skip Counting or Multiples
In this lesson plan, 100 Chart-Math Helper-Skip Counting or Multiples, learners utilize the chart as an aid in counting. This is a resource or manipulative that can be used by students, and is helpful in many different math activities...
Curated OER
Online Math Facts Games
Pupils use online games to reinforce math-facts knowledge, engage in a game the way they might be engaged in an arcade game, and try to be one of the class's top-scorers each week. A good filler or extension activity.
Math Moves U
Collecting and Working with Data
Add to your collection of math resources with this extensive series of data analysis worksheets. Whether your teaching how to use frequency tables and tally charts to collect and organize data, or introducing young mathematicians to pie...
CK-12 Foundation
Interpretation of Circle Graphs: Northwest Region Population Pie
Given populations of the five Northwestern states, learners create a circle graph. Using the data and the pie chart, they make comparisons between the populations of the states. Finally, the pupils determine how the chart will change...
Math Learning Center
Fourth Grade Assessments and Scoring Checklists, Common Core State Standards
Find out how your class is progressing in math with a set of assessments. Learners finish a baseline assignment to assess where they are beginning the year and then work on tests with increasing difficulty as the year progresses.
Math Learning Center
Addition Strategies
Help young mathematicians refer to simple addition strategies with a set of math posters. The pages feature ways to remember how to add zero to a number, how to determine if a number is odd or even, and making fast tens.
Curriculum Corner
16 Fall Themed Math and Literacy Centers for Kindergarteners
Look no further because your fall literacy and math centers are here. Cards allow learners to practice counting, writing, tracing, finding missing numbers and letters, skip count, and match letters to their sounds.
Curated OER
The Mitten
Explore the Ukraine through a reading of The Mitten. Readers will determine the sequence of events, cause and effect, make predictions, and find the main idea of the story. They also use math skills to make charts and graphs. Finally,...
North Carolina State University
Exploring Genetics Across the Middle School Science and Math Curricula
Where is a geneticist's favorite place to swim? A gene pool. Young geneticists complete hands-on activities, experiments, and real-world problem solving throughout the unit. With extra focus on dominant and recessive genes, Punnett...
Curated OER
Sunshine Math-1
In this math skills worksheet, students answer 7 questions in which they use various basic math skills. They use number lines, charts, number blocks, a calendar and a ruler to complete this worksheet.
Curated OER
Games on Echolocation
Get a little batty with life science! This fun simulation game replicates how bats use echolocation to hunt moths in their native Hawaiian habitat. After creating blind folds and discussing some basic principles of echolocation, students...
Curated OER
Multiplication Charts
This resource consists of a series of three fill in the blank multiplication charts each of which have different missing information to be plugged in. Students need to fill in a total of 90 numbers over the course of these three pages....
Curated OER
Math Centers
Fifth graders review the concepts of fractions: improper, mixed, proper, like denominator addition. They then review the concepts of creating pie graphs using a percent circle using manipulatives.
Virginia Department of Education
Graphs
Examine different types of graphs as a means for analyzing data. Math scholars identify the type of graph from a series of data displays and then develop questions to match each one. Then, given a scatter plot of height versus age data,...
Other popular searches
- Charts and Graphs Math
- Kwl Charts Math
- Input Output Math Charts
- Kl Charts Math
- T Charts in Math
- Kl Charts Math 6th
- Kwl Charts Math 6th
- Free Math Charts
- Input/output Math Charts
- Kwl Charts Math Lesson
- Math Charts Graphs
- Reading Math Charts


