Little 10 Robot
YodelOh™ Math Mountain
Save the yodeler from falling off the top of the mountain using basic math skills. Have endless fun while developing fluency with addition, subtraction, multiplication, and division.
University of Missouri
Money Math
Young mathematicians put their skills to the test in the real world during this four-lesson consumer math unit. Whether they are learning how compound interest can make them millionaires, calculating the cost of remodeling their bedroom,...
Math Worksheets Land
Pie or Circle Graphs Problems - Independent Practice Worksheet
Third graders take a set of data and turn it into a pie graph with an independent worksheet. Containing 10 sets of data, the resource reinforced data analysis skills that pupils can use throughout a graphing unit.
Curated OER
100 Chart-Math Helper-Skip Counting or Multiples
In this lesson plan, 100 Chart-Math Helper-Skip Counting or Multiples, learners utilize the chart as an aid in counting. This is a resource or manipulative that can be used by students, and is helpful in many different math activities...
Curated OER
Five Minute Frenzy Charts (E)
In this multiplication facts worksheet, students complete four 10 by 10 grid charts with multiplication facts to 144. Students try to complete each chart in less than five minutes and score 98% or better.
Curated OER
Five Minute Frenzy Charts (F)
In this multiplication facts worksheet, students complete four 10 by 10 grid charts with multiplication facts to 144. Students try to complete each chart in less than five minutes and score 98% or better.
Curated OER
Five Minute Frenzy Charts (G)
In this multiplication facts worksheet, students complete four 10 by 10 grid charts with multiplication facts to 144. Students try to complete each chart in less than five minutes and score 98% or better.
Curated OER
Multiplication Five Minute Frenzy Charts (B)
In this multiplication facts instructional activity, students complete four 10 by 10 grid charts with multiplication facts to 144. Students try to complete each chart in less than five minutes and score 98% or better.
Curated OER
Multiplication Five Minute Frenzy Charts (C)
For this multiplication facts worksheet, students complete four 10 by 10 grid charts with multiplication facts to 144. Students try to complete each chart in less than five minutes and score 98% or better.
Curated OER
Five Minute Frenzy Charts (D)
In this multiplication facts worksheet, students complete four 10 by 10 grid charts with multiplication facts to 144. Students try to complete each chart in less than five minutes and score 98% or better.
Curated OER
Using Graphs and Charts
Students complete T charts and manipulate numbers using graphs and charts. In this math graphs and charts lesson, students review the concepts of pattern and function. Students then complete practice pages where they manipulate numbers...
Curated OER
Discovering Math: Beginning Measurement
Young mathematicians are shown a ruler, yardstick, tape measure and scale. They practice measuring length, width, height, and weight. They are then shown a thermometer, and discuss what a thermometer is used for. Everyone is shown how to...
Curated OER
Create a Graph Online
Scholars create colorful bar, line, or pie graphs. They decide on a survey question to ask or a type of data to gather. From there, they collect information and data. They display this data in bar, line, or pie graphs that they create...
Curated OER
Charting and Graphing Sales
Pupils analyze and represent weekly sales figures using tables, bar graphs, and pie charts. They draw conclusions using bar graphs and pie charts. Students are told that each day at school they have the option of buying or bringing a...
Curated OER
Using Groups of Ten to Solve Problems
Upper graders solve math problems involving multiplication using specific strategies. They will use base-ten blocks, hundreds charts, and number lines to solve multiplication problems. Then they will practice several of the strategies...
Curated OER
Exploring Renewable Energy Through Graphs and Statistics
Ninth graders identify different sources of renewable and nonrenewable energy. In this math lesson, learners calculate their own carbon footprint based on the carbon dioxide they create daily. They use statistics to analyze data on power...
Curated OER
Multiplication Snack Activity
Youngsters study multiplication facts by manipulating food in order to problem solve. They will use healthy snack items as manipulatives to solve various multiplication equations. Charts, tables, physical models, and so much more are...
Curated OER
Humongous Vegetables
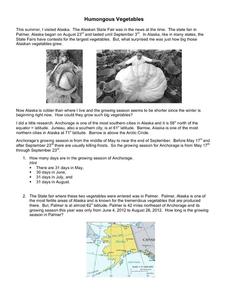
Humongous vegetables can inspire and awaken your mathematicians to the large math concepts in our Common Core standards. What is the secret to growing such gargantuan garden objects in Alaska? In the state that is closest to the North...
Curated OER
Many Ways to Represent Our Data
Demonstrate several ways to represent data with your class. They will use surveys to gather data and display the data using tally charts and graphs. Then answer questions according to the data.
Curated OER
Free Printables: Easy Graphs
In this counting and charting worksheet, students compete the chart using either colors or the stickers provided. Teachers can determine the subject of the chart by using the worksheet generator.
Curated OER
A Nation of Nations Lesson Plan: Charting African Ethnicities in America
Students read a portion of the narrative, The Transatlantic Slave Trade, to explain the ethnic origins of enslaved Africans brought to the US. They create charts and bar graphs comparing ethnicities in the lowlands and tidewater regions.
Curated OER
Hundreds Charts
In this hundreds charts activity, students fill in the hundreds charts that are completely blank, have the 5's filled in, and have the 10's filled in. Students have 3 charts to fill in.
Curated OER
Too Free, Or Not Too Free?
Students create a survey that examines what level of electronic surveillance might be acceptable to members of the school and community. They poll the community, and analyze the results in the form of graphs and a written news article.
Curated OER
Five Minute Frenzy (H)
In this multiplication facts worksheet, students complete four 10 by 10 grid charts with multiplication facts to 144. Students try to complete each chart in less than five minutes and score 98% or better.


