Concord Consortium
Look but Do Not Touch
We seem to keep missing each other. A short task provides pupils with a quadratic function, as well as a linear function with a missing coefficient. They must determine the value of the coefficient for which the graphs do not intersect.
Mathematics Assessment Project
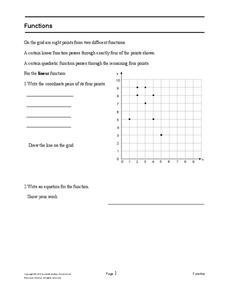
Functions
After identifying which of the given coordinate points fall on the graph of a line and which fall on the graph of a parabola, pupils write equations for each function.
EngageNY
End-of-Module Assessment Task - Algebra 2 (Module 1)
A series of assessment tasks require learners to process information and communicate solutions. Topics include graphing parabolas, solving linear-quadratic systems, factoring polynomials, and solving polynomial equations.
Concord Consortium
Betweenness II
Read between the curves ... quadratic curves! Young scholars analyze the graphs of two quadratic functions by writing their own function whose outputs are between the two given. They then consider intersecting quadratic functions and...
Concord Consortium
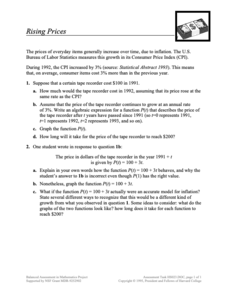
Rising Prices
What will that cost in the future? The scenario provides pupils with a growth as a Consumer Price Index. Learners create functions for a given item to determine future prices and graph them. Class members then compare their functions to...
EngageNY
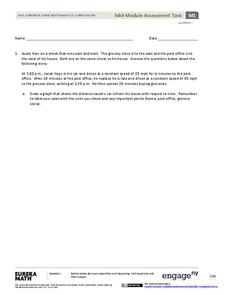
Mid-Module Assessment Task - Algebra 1 (module 1)
Looking for performance tasks to incorporate into your units? With its flexibility, this resource is sure to fit your teaching needs. Use this module as a complete assessment of graphing linear scenarios and polynomial operations, or...
EngageNY
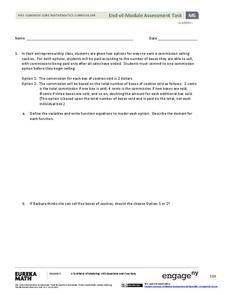
End-of-Module Assessment Task - Algebra 1 (Module 5)
This unit assessment covers the modeling process with linear, quadratic, exponential, and absolute value functions. The modeling is represented as verbal descriptions, tables, graphs, and algebraic expressions.
Curated OER
Birds' Eggs
More than just data, scatter plots are full of information that can be used to answer a variety of questions. This lesson uses a plot with information about bird egg sizes to answer questions about the relationship between length and...
EngageNY
Modeling a Context from a Verbal Description (part 2)
I got a different answer, are they both correct? While working through modeling problems interpreting graphs, the question of precision is brought into the discussion. Problems are presented in which a precise answer is needed and others...
EngageNY
Constant Rates Revisited
Find the faster rate. The resource tasks the class to compare proportional relationships represented in different ways. Pupils find the slope of the proportional relationships to determine the constant rates. They then analyze the rates...
CCSS Math Activities
Smarter Balanced Sample Items: 8th Grade Math – Claim 2
Math can be a problem in eighth grade. Sample items show how problem solving exists within the eighth grade standards. Part of the Gr. 8 Claim 2 - 4 Item Slide Shows series, the presentation contains eight items to illustrate the...
CCSS Math Activities
Smarter Balanced Sample Items: 8th Grade Math – Claim 3
Communication is the key. A dozen sample items require scholars to communicate their reasoning involved in arriving at a solution. The PowerPoint from the Gr. 8 Claim 2 - 4 Item Slide Shows series uses a variety of content to illicit...
Inside Mathematics
Population
Population density, it is not all that it is plotted to be. Pupils analyze a scatter plot of population versus area for some of the states in the US. The class members respond to eight questions about the graph, specific points and...
EngageNY
Conversion Between Celsius and Fahrenheit
Develop a formula based upon numerical computations. The 31st part of a 33-part unit has the class determine the formula to convert a temperature in Celsius to a temperature in Fahrenheit. They do this by making comparisons between the...
College Board
2006 AP® Statistics Free-Response Questions
Catapult the class into the test. Released items from the free-response section of the 2006 AP® Statistics exam ask individuals to use statistics to figure out the best catapult for determining the accuracy of thermometers. The six...
Inside Mathematics
Conference Tables
Pupils analyze a pattern of conference tables to determine the number of tables needed and the number of people that can be seated for a given size. Individuals develop general formulas for the two growing number patterns and use them to...
EngageNY
Mid-Module Assessment Task: Grade 8 Module 6
Make sure pupils have the skills to move on to the second half of the module with a mid-module assessment task. The formative assessment instrument checks student learning before moving on to the rest of the lessons in the unit.
Mathematics Assessment Project
College and Career Readiness Mathematics Test A2
A six-page evaluation covers material included in algebra, geometry, and algebra II. Applied word problems are mixed in with short answer questions. It also provides questions on mathematical reasoning.
CCSS Math Activities
Smarter Balanced Sample Items: 8th Grade Math – Claim 4
A math model is a good model. A slide show presents 10 sample items on modeling and data analysis. Items from Smarter Balanced illustrate different ways that Claim 4 may be assessed on the 8th grade math assessment. The presentation is...
Balanced Assessment
Fit-Ness
Serve four towns with one bus route. Pupils develop a bus route that meets certain criteria to serve four towns. They determine which of the routes would best serve all of them. Individuals then hypothesize where a fifth town should be...
EngageNY
Analyzing a Data Set
Through discussions and journaling, classmates determine methods to associate types of functions with data presented in a table. Small groups then work with examples and exercises to refine their methods and find functions that work to...
EngageNY
Mid-Module Assessment Task: Grade 7 Mathematics Module 4
Assess the ability of the class to solve percent problems with an assessment that covers a variety of percent problems from basic to multi-step. Pupils make connections between percent problems and proportional thinking to complete the...
Mathematics Assessment Project
College and Career Readiness Mathematics Test B1
Math was easier before it got mixed up with the alphabet. A 10-page test covers material from multiple years of high school math. Scholars demonstrate knowledge across domains with a mixture of short answer and applied problems.
Illustrative Mathematics
Equations of Lines
The intent of this resource is to show algebra learners that there is a proportional relationship between two lines that have an intersecting point. As the coordinate x increases by a constant, the y coordinate also increases. It will...
Other popular searches
- Graphing Linear Equations
- Graphing Lines
- Graphing Linear Systems
- Graphing a Linear Equation
- Algebra Graphing Lines
- Graphing Lines Quilt Pattern
- Graphing Nonlinear Equations
- Pre Algebra Graphing Lines
- Graphing. Linear Equation
- Area Graphing Lines
- Ged Graphing Lines


