Curated OER
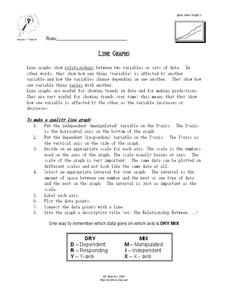
Line Graphs
In this algebra worksheet, students describe the relationship between a line graph and its data. They define the reasons line graphs are used and discuss increasing and decreasing lines. There is one involved questions, requiring several...
Curated OER
Measurement
In this measurement instructional activity, 7th graders solve 14 various types of problems that include completing a table with the base, height, and/or area of triangles and solving a number of word problems with measurement. They also...
Curated OER
Telling Time Worksheet: Drawing Hands on a Clock
Can your learners tell time? Give them practice with this resource. For each of nine clocks, youngsters must use the numerical time to draw the hands on the clock.
Charleston School District
Increasing, Decreasing, Max, and Min
Roller coaster cars traveling along a graph create quite a story! The lesson analyzes both linear and non-linear graphs. Learners determine the intervals that a graph is increasing and/or decreasing and to locate maximum and/or minimum...
National Council of Teachers of Mathematics
National Debt and Wars
Take a functional approach to the national debt. Learners collect information about the national debt by decade and plot the data. They determine whether an exponential curve is a good fit for the data by comparing the percent changes...
Curated OER
Telling Time By 5 Minute Increments
Young learners practice telling time from analog clock illustrations. There are nine illustrations here, all illustrating increments of five. You could use this worksheet for practice or a short quiz.
Curated OER
Graphs and Transformations of Functions
Is it possible to solve quadratic equations by factoring? It is, and your class will graph quadratic equation and functions too. They perform transformation on their graphs showing increasing and decreasing intervals, domain, and range....
Curated OER
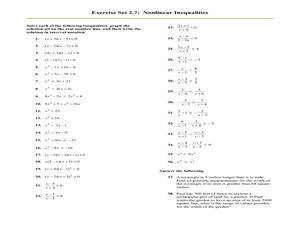
Nonlinear Inequalities
In this Algebra II worksheet, 11th graders solve nonlinear inequalities, graph the solution set on the number line, and write the solution in interval notation. The one page worksheet contains thirty-eight problems. Answers are provided.
Virginia Department of Education
Numbers in a Name
What's in a name? Pupils create a data set from the number of letters in the names of classmates. Each group then takes the data and creates a visual representation, such as a histogram, circle graph, stem-and-leaf plot, etc.
Curated OER
Center of Mass, Tangent Line Error Bound
In this center of mass worksheet, learners determine the center of mass of an isosceles triangle. They examine functions and determine the tangent error bound. This one-page worksheet contains 5 problems.
Mathematics Assessment Project
Middle School Mathematics Test 3
Real-life mathematics is not as simple as repeating a set of steps; pupils must mentally go through a process to come to their conclusions. Teach learners to read, analyze, and create a plan for solving a problem situation. The provided...
Curated OER
Organizing Data
In this organizing data worksheet, 7th graders solve seven different types of problems related to data. They first identify the type of data as categorical, discrete or continuous from the information given. Then, students use Excel to...
Concord Consortium
Calculator Numbers
Know thy calculator. Young mathematicians use their calculators to answer a set of questions. They consider how the number of digits the calculator displays affects the answers to calculations. They then find examples of computations...
Illustrative Mathematics
Running a Mile
The single question in this activity has multiple ways to be solved. Two boys ran a mile. Their times were similar, except one time was a fraction of the other. Who ran faster? In demonstrating the answer to this problem, upper graders...
Alabama Learning Exchange
Sky High
How are skyscrapers built? What does it take to make a structurally sound building? How can one work within a budget to complete a building project? These guiding questions will be investigated and answered within a hands-on lesson....
NASA
Understanding the Effects of Differences in Speed—Problem Set D
Fall back and slow down. The fourth lesson in a six-part series on air traffic control leads the class to find the difference in distance traveled based upon the difference in speed. Pupils work through a problem related to walking...
Curated OER
One Whole and Its Fractional Parts
In this discovering fractions worksheet, students read explanations with examples of fractional parts and mixed numbers and use them to create fractions. Students write four answers.
West Contra Costa Unified School District
Average Rate of Change
The concept of slope gets an approachable, yet theoretical, treatment in a comprehensive algebra lesson. The use of functional notation and problem-solving techniques keep the material rigorous, but detailed teaching notes and lots of...
Curated OER
Drive the Data Derby
Three days of race car design and driving through the classroom while guessing probability could be a third graders dream. Learn to record car speed, distances traveled, and statistics by using calculation ranges using the mean, median,...
Curated OER
Sum of Even and Odd
Your algebra learners will make use of structure and manipulate expressions involving function notation using the definition of odd and even functions. They then advance even further to analyze the structure in a system of two equations.
Howard County Schools
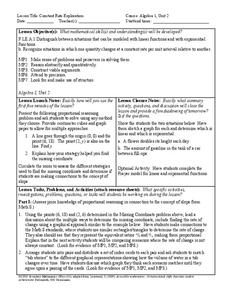
Constant Rate Exploration
Question: What do rectangles and bathtub volume have in common? Answer: Linear equations. Learn how to identify situations that have constant rates by examining two different situations, one proportional and one not proportional.
Curated OER
Time to Cook!
Don't let the cupcakes burn! Using cooking procedure, learners practice drawing minute and hour hands onto five analog clock faces. They read five scenarios which require them to add time increments to find the time required for each...
Curated OER
Using Graphs
In this using graphs worksheet, 9th graders solve and complete 6 different types of problems. First, they determine how the transformation shown moves the graph. Then, students find the interval that is defined given the coordinates....
Curated OER
Lab Sheet: Exponential Growth and Decay
In this exponential instructional activity, students gather information from an experiment and plot the data in a scatter plot. Using given formulas, they plot an equation of a line and then compare the graphs. Students observe...


