EngageNY
Interpreting Correlation
Is 0.56 stronger than -0.78? Interpret the correlation coefficient as the strength and direction of a linear relationship between two variables. An algebra instructional activity introduces the correlation coefficient by estimating...
EngageNY
Relationships Between Two Numerical Variables
Is there another way to view whether the data is linear or not? Class members work alone and in pairs to create scatter plots in order to determine whether there is a linear pattern or not. The exit ticket provides a quick way to...
Inside Mathematics
Scatter Diagram
It is positive that how one performs on the first test relates to their performance on the second test. The three-question assessment has class members read and analyze a scatter plot of test scores. They must determine whether...
Mathematics Assessment Project
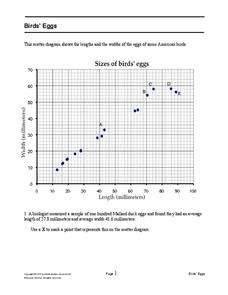
Bird’s Eggs
Are the length and width of birds' eggs related? Young ornathologists use a scatter plot to investigate the relationship between the length and width of eggs for Mallard ducks. They then determine the egg with the greatest...
Inside Mathematics
Population
Population density, it is not all that it is plotted to be. Pupils analyze a scatter plot of population versus area for some of the states in the US. The class members respond to eight questions about the graph, specific points and...
Inside Mathematics
Snakes
Get a line on the snakes. The assessment task requires the class to determine the species of unknown snakes based upon collected data. Individuals analyze two scatter plots and determine the most likely species for five...
Inside Mathematics
House Prices
Mortgages, payments, and wages correlate with each other. The short assessment presents scatter plots for young mathematicians to interpret. Class members interpret the scatter plots of price versus payment and wage versus payment for...
Curated OER
US Airports, Assessment Variation
Determining relationships is all part of algebra and functions. Your mathematicians will decide the type of relationship between airports and population and translate what the slope and y-intercept represent. The problem is multiple...
EngageNY
Interpreting Residuals from a Line
What does an animal's gestation period have to do with its longevity? Use residuals to determine the prediction errors based upon a least-square regression line. This second lesson on residuals shows how to use residuals to create a...
Mathematics Assessment Project
Sugar Prices
Sugar rush! In this assessment task, learners interpret points on a scatter plot representing price versus weight for bags of sugar. They then determine the bag that represents the best value.
Inside Mathematics
Archery
Put the better archer in a box. The performance task has pupils compare the performance of two archers using box-and-whisker plots. The resource includes sample responses that are useful in comparing individuals' work to others.
Concord Consortium
People and Places
Graph growth in the US. Given population and area data for the United States for a period of 200 years, class members create graphs to interpret the growth over time. Graphs include population, area, population density, and population...
College Board
2000 AP® Statistics Free-Response Questions
A little communication goes a long way. Free-response questions from the 2000 AP® Statistics exam require pupils to communicate their results—not just perform calculations. The questions ask individuals to explain, discuss, and interpret...
EngageNY
Mid-Module Assessment Task: Grade 8 Module 6
Make sure pupils have the skills to move on to the second half of the module with a mid-module assessment task. The formative assessment instrument checks student learning before moving on to the rest of the lessons in the unit.
CCSS Math Activities
Smarter Balanced Sample Items: High School Math – Claim 2
Problem solve across the content standards. The presentation slides provide 19 sample items from the Smarter Balanced high school assessment. Items illustrate Claim 2, problem solving, of the test and are drawn from all the high school...
Curated OER
Coffee and Crime
Is there a correlation between the number of coffee shops and the amount of crime in a given area? In this quick exercise, your class will examine the data, interpret the results, and discuss their conclusion. Concepts covered include...
Curated OER
Texting and Grades II
Given the least squares regression line, interpret the slope and intercept in the context of the relationship between texting and GPA. Although this task is short and looks simple, some subtle points can be brought to light in a...
Khan Academy
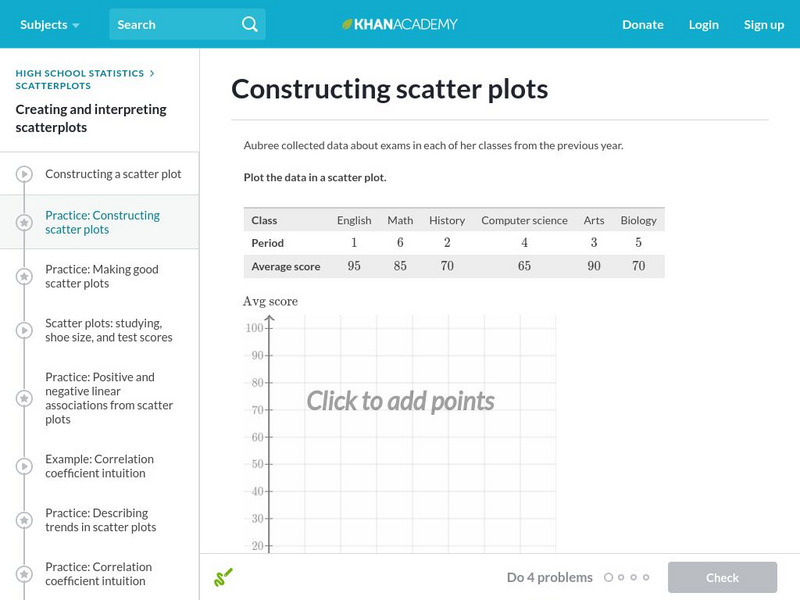
Khan Academy: Constructing Scatter Plots
Practice plotting points to construct a scatter plot. Students receive immediate feedback and have the opportunity to try questions repeatedly, watch a video, or receive hints.
Khan Academy
Khan Academy: Describing Trends in Scatter Plots
Practice making sense of trends in scatter plots. That is, explain what trends mean in terms of real-world quantities. Students receive immediate feedback and have the opportunity to try questions repeatedly, watch a video, or receive...
Khan Academy
Khan Academy: Positive and Negative Linear Associations From Scatter Plots
Practice identifying the types of correlations shown in scatter plots. Sometimes we see linear correlations (positive or negative), sometimes we see non-linear correlations (the data seems to follow a curve), and other times we don't see...
Khan Academy
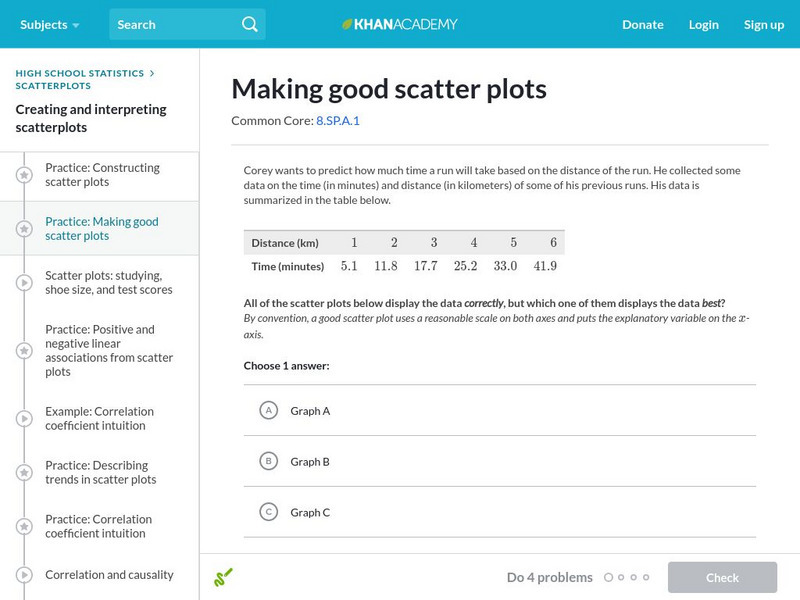
Khan Academy: Making Good Scatter Plots
A good scatter plot has the independent variable on the x-axis and the dependent variable on the y-axis. Also, the scale of both axes should be reasonable, making the data as easy to read as possible. In these practice problems, we...
Khan Academy
Khan Academy: Interpreting Slope and Y Intercept of Lines of Best Fit
Practice explaining the meaning of slope and y-intercept for lines of best fit on scatter plots. Students receive immediate feedback and have the opportunity to try questions repeatedly, watch a video, or receive hints.


