Curated OER
Discovering the Linear Relationship between Celsius and Fahrenheit
Middle schoolers discover the linear relationship between degrees Farenheit and degrees Celsius. They manually compute the slope and y-intercept of the line passing through points. They convert Celsius to Fahrenheit degrees.
Curated OER
Manipulating Graphs
Students graph real life situations. In this graphing instructional activity, students read situations and write an equation that matches. They graph the situations and analyze the slope and y-intercept
Curated OER
The Slope of a Curve
Pupils graph the slopes of a line using the intercepts. In this precalculus lesson, students identify the properties of a curve slope. They find the limit and use a graping calculator to graph their lines.
Curated OER
Find Equation of Straight Line
In this algebra worksheet, 9th graders are given the slope and y-intercept and asked to find the equation of a line. There are 7 questions with an answer key.
Curated OER
Write the equation of a line, given slope and a point
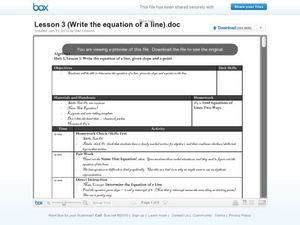
Young mathematicians write equations of lines in this algebra lesson. They solve linear equations into the slope intercept form. Next, they graph the lines using the slope and the y-intercept, and they write equations for the lines using...
Ed Migliore
Linear Equations in Two Variables
This traditional textbook style unit includes vocabulary, a direct explanation section, examples, practice problems that directly line up with the explanations and examples, and a unit summary review and practice problems. Learners get...
Willow Tree
Linear Relationships
There's just something special about lines in algebra. Introduce your classes to linear equations by analyzing the linear relationship. Young mathematicians use input/output pairs to determine the slope and the slope-intercept formula to...
Curated OER
Identifying Linear Functions from Graphs
Keep your mathematicians engaged using this group linear functions activity. Each of ten groups receives two graphs with both an image and equation, as well as a "who has" phrase to call out the next graph. Scholars stay on their toes as...
Curated OER
Worksheet 4: Graphs and One-Sided Limits
In this math worksheet, students answer 6 questions regarding functions, graphs, one-sided limits, intercepts, vehicle speed and wheel rotation.
Curated OER
Graphing Practice
Click on the download box to access this useful graphing lesson that includes worksheets for homework, assessment, and classroom work. The class graphs basic linear functions. They rewrite the equations from standard form into...
EngageNY
Two Graphing Stories
Can you graph your story? Keep your classes interested by challenging them to graph a scenario and interpret the meaning of an intersection. Be sure they paty attention to the detail of a graph, including intercepts, slope,...
Charleston School District
Graphs of Linear Functions
What does a slope of 2/3 mean? Develop an understanding of the key features of a linear function. Pupils graph the linear functions and explain the meaning of the slope and intercepts of the graphs.
EngageNY
Arc Length and Areas of Sectors
How do you find arc lengths and areas of sectors of circles? Young mathematicians investigate the relationship between the radius, central angle, and length of intercepted arc. They then learn how to determine the area of sectors of...
EngageNY
The Graph of a Linear Equation in Two Variables Is a Line
Show your class that linear equations produce graphs of lines. The 20th segment in a unit of 33 provides proof that the graph of a two-variable linear equation is a line. Scholars graph linear equations using two points, either from...
CPALMS
Writing an Exponential Function from its Graph
Grow an equation for the exponential graph. Given a graph of an exponential function, class members write the equation of the function provided. The graph labels two points on the graph: the y-intercept and the point where x is one.
Shodor Education Foundation
Linear Inequalities
An interactive lesson helps individuals learn to graph inequalities in two variables. Scholars can adjust the interactive to present the inequalities in standard or slope-intercept form.
CCSS Math Activities
Smarter Balanced Sample Items: High School Math – Target E
Pupils rewrite expressions in equivalent forms to identify key features. They use the vertex and factored forms of quadratic expressions to identify the extrema and intercepts. To finish the installment of the Claim 1 Item Slide Show...
Corbett Maths
Angles in the Same Segment – Proof
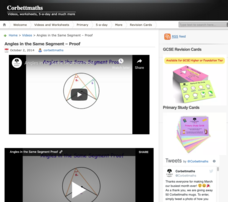
If angles intercept the same arc, the angles must be the same size. The quick video talks through the proof of showing the reason two inscribed angles that intersect the same arc have the same measurement. Pupils then create their own...
PHET
Graphing Lines
Ready to increase pupils' understanding of slope with an upward slope? Scholars use an interactive that allows users to move two points on a coordinate plane. The interactive then automatically calculates the slope, the slope-intercept...
Flipped Math
Calculus AB/BC - Sketching Graphs of Functions and Their Derivatives
Find deeper meaning in graphs. Pupils use the knowledge gained from the previous sections in the unit to sketch graphs of a function's derivative. Learners also see how to sketch a graph of a function given the graph of its derivatives....
Curated OER
Linear Equations
Eighth and ninth graders solve and graph 42 different problems that include writing various equations and graphing them on a grid. First, they create a table for each equation and graph it on a grid locating the x-and y-intercepts. Then,...
Curated OER
Compound Inequalities and Graphing
Put geometry skills to the test! Learners solve compound inequalities and then graph the inequalities on a coordinate plane using their geometric skills. They identify the slope and y-intercept in order to graph correctly. I like this...
Illustrative Mathematics
Which Function?
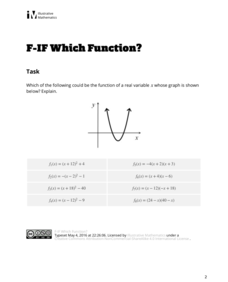
Throw some logic into quadratics and see if learners can match a vague graph to multiple equations. Young mathematicians must look at quadrant location, vertices, and intercepts to best match the graph to one or more equations.
Bowland
Football, the Beautiful Game
Discover how to use mathematics to make a stronger soccer team. Young soccer enthusiasts use given data to make decisions about a soccer team. They decide which position to assign each player, consider what makes a good pass and...
Other popular searches
- Slope Intercept Form
- Slope and Y Intercept
- Slope Intercept
- Y Intercept
- X and Y Intercepts
- Slope Intercept Form
- X Intercept
- Y Intercepts
- Slope Intercept
- Slope Intercept Equation
- Slope and Y Intercept
- Writing Slope Intercept Form


