Science Geek
Periodic Tables
Chemistry jokes only come up periodically, despite the fact that many different periodic tables have been used throughout history. Find out more about various versions in a presentation that includes information about the Mendeleev's,...
CK-12 Foundation
Function Rules for Input-Output Tables: Soda Sugar Function Table
Examine the relationship between the input and output variables in a table of values. As learners build an input-output table using online manipulatives, they begin to identify patterns. They answer questions about these patterns and...
CK-12 Foundation
Frequency Tables to Organize and Display Data: Favorite Films
What information can your class determine if they know the number of people attending movie showings? Using the information about the number of people at each screening, learners develop a frequency table. The pupils analyze the type of...
Curated OER
Student Costs Data Table
Young scholars compare and contrast two routes selected for a virtual field trip. They create a data table of educational activities, lodging, and meal costs using Microsoft Excel software.
CK-12 Foundation
Line Plots from Frequency Tables: Sleep Cycles
Demonstrate the ease of using a frequency table. An interactive lesson allows learners to create a frequency table efficiently. Challenge questions ask your classes to analyze the data represented in the frequency table.
CK-12 Foundation
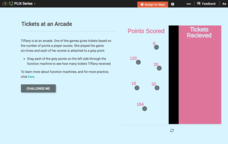
Function Rules for Input-Output Tables: Tickets at an Arcade
This is the ticket to learning about function rules! Using online manipulatives, scholars build a table of values and then answer questions about the related function. They examine the relationship between the input and output values and...
CK-12 Foundation
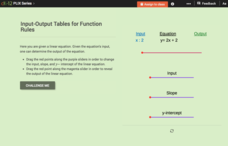
Input-Output Tables for Function Rules
How does changing a graph affect the function? Learners watch the changing input-output table as they adjust the location of the line graph. Questions prompt them to complete a table of values and determine the function rule.
CK-12 Foundation
Evaluate Limits Using Graphs and Tables: Where Is That Limit?
Limits are made easy through graphs and tables. An easy-to-use interactive lets users change a function on a coordinate plane. They relate graphs and tables to the limit at a specific value.
Curated OER
Fish Communities in the Hudson
Learning to read data tables is an important skill. Use this resource for your third, fourth, or fifth graders. Learners will will study tables of fish collection data to draw conclusions. The data is based on fish environments in the...
Curated OER
HTML Table Formatting
Learners format an existing table by using cell padding and cell spacing. They add color to the table as well as align text within the table. They open the HTML_table2 document for instructions and display a basic understanding of HTML...
CK-12 Foundation
Polynomials and Factoring: Classification Table
It all depends upon the terms. Pupils use the interactive table to sort polynomials. The scholars determine the names for the types of polynomials based on the number of terms.
CK-12 Foundation
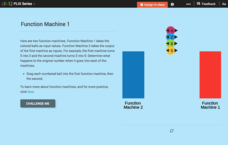
Function Rules for Input-Output Tables: Function Machine 1
Challenge your classes to find the pattern of a double function machine. After recording the outputs of both machines, learners identify the pattern and the corresponding function. Both patterns involve adding/subtracting a constant.
CK-12 Foundation
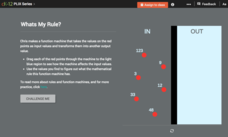
Function Rules for Input-Output Tables: Whats My Rule?
What's the rule that makes it true? A virtual function machine generates output values as learners submit the input values. Their job is to analyze the inputs and outputs for a pattern and write a function rule.
CK-12 Foundation
Function Rules for Input-Output Tables: Function Machine!
Watch as a function machine converts an input to an output. Learners determine the work applied by the function machine to write a function rule. Questions accompany the function machine animation to guide individuals to conclusions.
CK-12 Foundation
Input-Output Tables for Function Rules
Make the abstract a bit more concrete with an interactive that asks learners to slide an input value through a function to determine the output. Changing the slope and y-intercept allows them to see the how the output values change.
CK-12 Foundation
Bar Graphs, Frequency Tables, and Histograms: Comparing Heights
Become a master at creating visual displays. Using a provided list of heights, users of the interactive create a bar graph and a histogram. They answer a set of challenge questions based on these data representations.
CK-12 Foundation
Conversion of Decimals, Fractions, and Percents
Five questions—true or false and multiple-choice—challenge mathematicians to convert decimals, fractions, and percents. An interactive table displays how to write a portion of shapes in a variety of ways. A discussion question concludes...
CK-12 Foundation
Evaluate Limits Using Graphs and Tables: Evaluate the Limits
Discontinuities in the graph? No worries. Pupils investigate the limit of a function given graphically using an interactive. The graph has removable and jump discontinuities.
Curated OER
Background of Diseases-- Germs or Genes?
Students explore the background of common diseases. In this personal health lesson, students research causative agents of communicable and non-communicable diseases. Students use their research findings to create data tables in Microsoft...
Curated OER
Using GIS to Construct Water Table Maps and Flow Nets
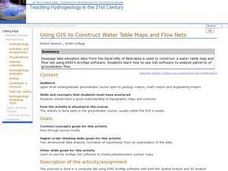
Students examine how to use GIS software to analyze patterns of groundwater flow. Seepage lake elevation data from the Sand Hills of Nebraska is used to construct a water table map and flow net using Esri's Arc Map software.
CK-12 Foundation
Understand and Create Histograms: Histograms
Tally ho! Represent the frequency of ages at school. Pupils finish a tally chart to match the frequencies of ages at school. Using the frequencies, the learners create a histogram. With the aid of the histogram and the frequency table,...
CK-12 Foundation
Frequency Polygons: Constructing a Frequency Polygon
Connect the dots on frequency. Given a distribution table of scores on an assessment, learners create a frequency polygon by moving points on a graph to the correct frequency. The pupils use the display to answer questions about the...
Curated OER
Tables
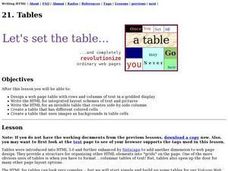
Students design a web page table with rows and columns of text in a gridded display. They write a HTML for integrated layout schemes of text and pictures. They create a table that has different colored cells.
CK-12 Foundation
Circles Not Centered at the Origin: Room Rearranging
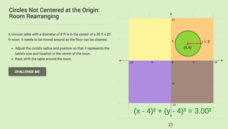
Where does a circular table fit best? Individuals move a circle representing a table into different quadrants of a room. Pupils determine which equation of the circle will place the table in the appropriate quadrant. A discussion...


