Open Oregon Educational Resources
Forest Measurements: An Applied Approach
Geometry—it's not just for the math classroom! Learners explore the field of forestry through a mathematical lens. An instructional resource explains how forest workers collect data about trees such as height, diameter, and age using...
Radford University
Body Measurement Activity
Don't keep the resource at an arm's length. A hands-on activity has scholars measure the heights, arm spans, hair lengths, and foot lengths of their classmates. They create scatter plots to determine if there is a correlation between...
Radford University
Are Kitchen Cabinets at the Correct Height? Lesson 6
Don't hit your head on the kitchen cabinet. Using previously collected female height data, scholars apply confidence intervals and tests of significance to perform a data analysis. They connect the data to the height
of kitchen cabinets...
Statistics Education Web
How High Can You Jump?
How high can your pupils jump? Learners design an experiment to answer this question. After collecting the data, they create box plots and scatter plots to analyze the data. To finish the instructional activity, they use the data to...
American Statistical Association
Step into Statastics
Class members study the size of classmates' feet and perform a statistical analysis of their data. They solve for central tendencies, quartiles, and spread for the entire group as well as subgroups. They then write a conclusion based on...
Teach Engineering
Building-Testing-Improving Paper Airplanes: Head's Up!
Take foldables to all new heights. Pupils build and fly different types of paper airplanes in the 14th portion of a 22-part unit on aviation. Groups collect data on distance and flight time for each plane and compare the data from the...
Curated OER
Mystery Jars
This is a twist on the old "guess how many jellybeans" game. Using estimation and math skills, learners participate in a fun "mystery jars" activity, trying to make educated guesses at how many objects are in two jars. The basic activity...
Curated OER
A Tall Story
Students investigate the growth rate of a man named Bob Wadlow. In this growth rate of a man lesson, students determine if the growth rate of this particular man was normal or abnormal. Students bring in data of their height over time...
Curated OER
China's Population Growth
Learners collect data from China's population growth and determine the mean, median, and mode from the data. In this data lesson plan, pupils determine probabilities and use them to make predictions.
Curated OER
Do Not Open Until May 2000!
Students create a time capsule. In this time capsule lesson plan, students collect and record data about themselves to be stored in a time capsule that will be opened at the end of the year.
Curated OER
Numbers and Me
Students collect and graph data about themselves. In this collecting and graphing data instructional activity, students poll their classmates about how many siblings they have or they measure their height. Students make a bar graph of...
Curated OER
Data Habitats
Learners develop data acquisition skills and quantify descriptive data. In this data lesson students divide into groups and do an activity that shows them why it is important to record data with accuracy and consistency.
Statistics Education Web
Now You SeeIt, Now You Don't: Using SeeIt to Compare Stacked Dotplots to Boxplots
How does your data stack up? A hands-on activity asks pupils to collect a set of data by measuring their right-hand reach. Your classes then analyze their data using a free online software program and make conclusions as to the...
Curated OER
Height versus Shoe Size
Pupils find a correlation between a person's height and his/her shoe size. They have access to entering data into lists on a graphing calculator and can complete scatter plots. Students read and interpret a scatter plot and use the...
Curated OER
What's Your Shoe Size? Linear Regression with MS Excel
Learners collect and analyze data. For this statistics lesson, pupils create a liner model of their data and analyze it using central tendencies. They find the linear regression using a spreadsheet.
Curated OER
Piles of Paper
Track how much paper their class uses in a week. They will pile their used paper into one place, each day the pile is measured. They make predictions about how much paper they would collect in a month, then recycle the paper.
Houston Area Calculus Teachers
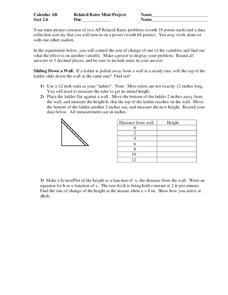
Related Rates
Use a hands-on approach to exploring the concepts of related rates in your AP Calculus class. Individuals explore the effect of the rate of change on a variable related to a variable they control. After analyzing the data they collect,...
Shodor Education Foundation
Scatter Plot
What is the relationship between two variables? Groups work together to gather data on arm spans and height. Using the interactive, learners plot the bivariate data, labeling the axes and the graph. The resource allows scholars to create...
Curated OER
Glass Transition in a Rubber Ball
Students illustrate the changes in the properties of a material at its glass transition point. They gather data which they use to construct graphs regarding elastic modules versus absorption modulus, tangent delta, and the effect of...
Curated OER
Float the Boat
Students collect data and analyze it using a graph. In this algebra activity, students identify different bodies of water and relate the flowing to math. They collect data on the rate of flow and the height of flow. They analyze the data...
Georgetown University
Cup-Activity: Writing Equations From Data
Determine how cup stacking relates to linear equations. Pupils stack cups and record the heights. Using the data collected, learners develop a linear equation that models the height. The scholars then interpret the slope and the...
Curated OER
Quantitative Data
In this quantitative data worksheet, pupils compute measures of central tendency, draw vertical line diagrams, and compare collected data. This 23-page worksheet contains approximately 100 multi-step problems. Explanations and examples...
K20 LEARN
Round and Round We Go
Connect the dots on trigonometry with K'nex. Scholars use a K'nex model of a Ferris wheel to collect data points to plot on a height versus time graph. They'll then consider what type of function best models the data in the graph—and...
Curated OER
Bounce Back Ball
Fifth graders work in teams of four to measure the rebound heights of a tennis ball dropped from four different heights. They investigate with the bouncing balls to measure changes in the type of energy they possess.


