Curated OER
Matrix Operations
Students solve problems using matrices. In this algebra lesson, students add, subtract and multiply matrices. They use the graphing calculator to simplify and graph linear equations.
Curated OER
Systems of Linear Inequalities in Slope-Intercept Form -- Lecture
Students are introduced to linear inequalities in slope-intercept form. As a class, they participate when needed in a demonstration given by their teacher and practice graphing inequalities and describing the solution. They set up and...
Curated OER
Slope of Line
For this algebra worksheet, learners calculate the slope of a line. They graph a linear equation given the slope and y-intercept and identify the slope and y-intercept given a linear graph. There are 15 questions.
Curated OER
Evaluating Functions
In this evaluating functions instructional activity, 11th graders solve and complete 24 various types of problems. First, they evaluate the functions for the given values. Then, students graph each of piecewise functions. They also write...
Curated OER
Convert Standard Form to Slope-Intercept Form
Ninth graders convert between the standard form of an equation and the y-intercept form. In this algebra lesson, 9th graders rewrite equations from their standard form into the y=mx + b form. They solve for y using the distributive...
CCSS Math Activities
Smarter Balanced Sample Items: 8th Grade Math – Claim 2
Math can be a problem in eighth grade. Sample items show how problem solving exists within the eighth grade standards. Part of the Gr. 8 Claim 2 - 4 Item Slide Shows series, the presentation contains eight items to illustrate the...
EngageNY
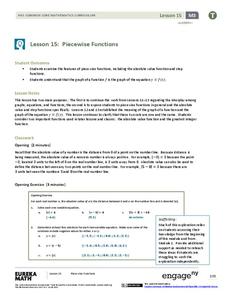
Piecewise Functions
Show your class members that if they can graph a linear function, they can graph an absolute value function. Groups create an absolute value graph using a table, then entertain the idea of an absolute value function defined as two pieces...
Inside Mathematics
Population
Population density, it is not all that it is plotted to be. Pupils analyze a scatter plot of population versus area for some of the states in the US. The class members respond to eight questions about the graph, specific points and...
Bowland
Alien Invasion
Win the war of the worlds! Scholars solve a variety of problems related to an alien invasion. They determine where spaceships have landed on a coordinate map, devise a plan to avoid the aliens, observe the aliens, and break a code to...
Mathematics Vision Project
Module 1: Sequences
Sequences are all about recognizing patterns. A module of 11 lessons builds pupils' understanding of sequences through pattern analysis. The practice connects the analysis to linear and exponential equations. This is the first module in...
EngageNY
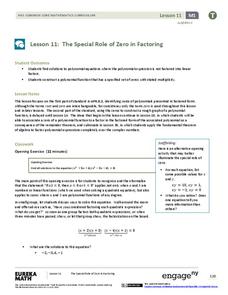
The Special Role of Zero in Factoring
Use everything you know about quadratic equations to solve polynomial equations! Learners apply the Zero Product Property to factor and solve polynomial equations. They make a direct connection to methods they have used with quadratic...
Flipped Math
Exponential Growth
They grow by leaps and bounds. Learners watch a quick review on function notation as they prepare to learn more about exponential growth. Using their knowledge from sequences, pupils find out whether a function is linear or exponential,...
Radford University
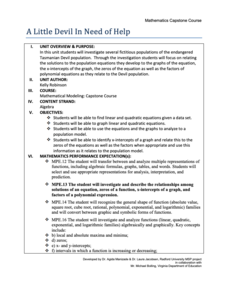
A Little Devil In Need of Help
Math modeling to help endangered species? Scholars first investigate linear and exponential equations and graphs that model fictitious animal populations. They consider how key features of the graphs relate to the situation. As a final...
Shodor Education Foundation
Sequencer
Take the first step into graphing sequences. Learners set the starting number, multiplier, add-on, and the number of steps for a sequence. Using the inputs, the interactive calculates and plots the sequence on the coordinate plane. Users...
Mathematics Vision Project
Module 9: Modeling Data
How many different ways can you model data? Scholars learn several in the final module in a series of nine. Learners model data with dot plots, box plots, histograms, and scatter plots. They also analyze the data based on the data...
Flipped Math
Solve Inequalities
One solves inequalities just like equations ... well, almost. Pupils watch a video lecture on solving linear inequalities. They practice solving inequalities, check their answers with the video, and continue to practice the concept with...
CK-12 Foundation
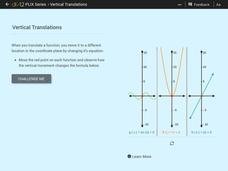
Vertical Translations
Change the y-intercept by adding a constant to the function. Individuals move three functions vertically along the y-axis. As they observe how the equation of the functions change with the vertical movement, learners determine how to...
College Board
2006 AP® Statistics Free-Response Questions
Catapult the class into the test. Released items from the free-response section of the 2006 AP® Statistics exam ask individuals to use statistics to figure out the best catapult for determining the accuracy of thermometers. The six...
Curated OER
Polynomials Functions
High schoolers factor polynomials and linear functions and apply concepts of the fundamental theorem of algebra to solve problems. They graph their solutions and analyze the graph.
Curated OER
Scatter Diagrams and Curve Fitting
In this Scatter Diagrams and Curve Fitting worksheet, students are guided in how to graph a scatter diagram (plot) and a Best Fit Line using a TI-83 graphing calculator.
Curated OER
Maximize It!
Students design a rectangular box without a lid that has the largest possible volume using the supplied sheet of centimeter graph paper. They work in groups to construct different size boxes to determine the largest possible volume and...
Curated OER
The Way to Better Grades!
Pupils collect and analyze data. In this statistics lesson, learners create a scatter plot from their collected data. They use, tables and graphs to analyze the data and mae decisions.
Curated OER
Algebraic Relationships
Here are 17 various forms of problems that range from matching equivalent expressions to word problems. Included are problems for substutiing values into expressions and using the order of operations, simplifying algebraic expressions,...
Other popular searches
- Algebra Graphing Lines
- Graphing Lines Quilt Pattern
- Linear Equations and Graphing
- Linear Equations Graphing
- Pre Algebra Graphing Lines
- Area Graphing Lines
- Ged Graphing Lines


