EngageNY
Writing and Graphing Inequalities in Real-World Problems
Inequalities: when one solution just doesn't suffice. Individuals learn to write inequalities in real-world contexts and graph solution sets on the number line. All inequalities in the instructional activity are of the form x < c or x...
Mathed Up!
Inequalities Regions
Discover how to solve systems of inequalities by graphing. An informative video shows pupils how to determine the solution set after graphing each inequality of a system. To finish, a worksheet gives them a chance to practice this skill.
Inside Mathematics
Graphs (2006)
When told to describe a line, do your pupils list its color, length, and which side is high or low? Use a instructional activity that engages scholars to properly label line graphs. It then requests two applied reasoning answers.
Illustrative Mathematics
Telling a Story With Graphs
Turn your algebra learners into meteorologists. High schoolers are given three graphs that contain information about the weather in Santa Rosa, California during the month of February, 2012. Graph one shows temperatures, graph two...
Balanced Assessment
Multi-Graphs
So many things change as time goes by. Here, scholars create graphs based on this premise. Each problem asks pupils to sketch a graph that describes a given situation. Their graphs represent various characteristics such as height,...
Mathed Up!
Inequalities
Develop an understanding of things that are not equal. The video demonstrates three types of questions involving inequalities as a review for the General Certificate of Secondary Education math assessment. Pupils work through the...
Balanced Assessment
Toilet Graph
Mathematics can model just about anything—so why not simulate the height of water in a toilet bowl? The lesson asks pupils to create a graphical model to describe the relationship of the height of the water as it empties and fills again....
Illustrative Mathematics
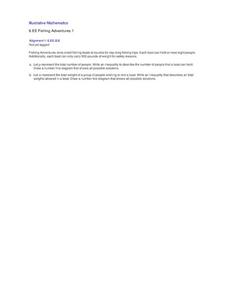
Fishing Adventures 1
Often inequalities exist in many real-world contexts but young math learners struggle with understanding how to represent that relationship in a simple equation using an inequality. This activity focuses on the basic concepts by using...
Achieve
Rabbit Food
Keep your pets slim, trim, and healthy using mathematics! Pupils use a linear programming model to optimize the amount and type of food to provide to a pet rabbit. They model constraints by graphing inequalities and use them to analyze a...
Inside Mathematics
Graphs (2007)
Challenge the class to utilize their knowledge of linear and quadratic functions to determine the intersection of the parent quadratic graph and linear proportional graphs. Using the pattern for the solutions, individuals develop a...
Mathematics Assessment Project
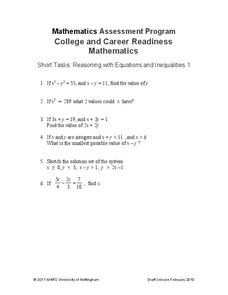
Reasoning with Equations and Inequalities
Provide class members with an opportunity to practice reasoning. A resource contains six skill-based items aligned to the Common Core. The items require pupils to reason abstractly and attend to precision.
Curated OER
What Functions do Two Graph Points Determine?
Your algebra learners write linear, exponential, and quadratic equations containing the same two graph points in this collaborative task.
Balanced Assessment
Bathtub Graph
Represent the relationship between independent and dependent variables through a modeling situation. The activity expects learners to graph the volume of water in a bathtub during a given scenario. The graph should result in two areas of...
Concord Consortium
Graphical Depictions
Parent functions and their combinations create unique graphical designs. Learners explore these relationships with a progressive approach. Beginning with linear equations and inequalities and progressing to more complex functions,...
EngageNY
Introduction to Simultaneous Equations
Create an understanding of solving problems that require more than one equation. The lesson introduces the concept of systems of linear equations by using a familiar situation of constant rate problems. Pupils compare the graphs of...
Illustrative Mathematics
Puzzle Times
Give your mathematicians this set of data and have them create a dot plot, then find mean and median. They are asked to question the values of the mean and median and decide why they are not equal. Have learners write their answers or...
Del Mar College
Algebra Assessment Review
Take the time out of preparing an algebra review and use this multiple-choice assessment to prep for the big test. Some included topics are factoring, FOILing, inequalities, and linear graphs.
Illustrative Mathematics
Fishing Adventures 2
This resource is part of a series which expects participants to be familiar with graphing inequalities on a number line. It is a word problem that asks your class to graph a discrete solution set and interpret it in the context of an...
Illustrative Mathematics
Sports Equipment Set
Many students like to play sports and the equipment that goes with it costs money. The resource sets up an inequality that gives a total amount needed to purchase the equipment and the initial amount of money already obtained. In order...
CCSS Math Activities
Smarter Balanced Sample Items: 7th Grade Math – Target D
Put expressions, equations, and inequalities to work! Young scholars solve problems using various strategies. Meant as a snapshot of the Smarter Balanced Assessment, a set of seven questions includes topics from writing expressions to...
CCSS Math Activities
Smarter Balanced Sample Items: High School Math – Target J
Good graphs make solving systems simpler. Pupils answer 18 questions shown in a PowerPoint presentation as part of the Claim 1 Item Slide Show series. By considering these questions, they review the concepts of graphing equations and...
Bowland
Problem Page
Future mathematicians use a given graph to answer a question about age differences in relationships. Along the way, they must find the equation and inequality of given graphs.
EngageNY
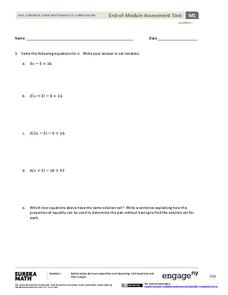
End-of-Module Assessment Task - Algebra 1 (Module 1)
What do your young geniuses really know? Assess the procedural knowledge of your pupils at the same time as their higher-level thinking with an assessment that identifies their depth of knowledge. Topics include solving...
Inside Mathematics
Sorting Functions
Graph A goes with equation C, but table B. The short assessment task requires class members to match graphs with their corresponding tables, equations, and verbalized rules. Pupils then provide explanations on the process they used to...
Other popular searches
- Inequalities Graphing
- Math Graphing Inequalities
- Inequalities and Graphing
- Algebra Graphing Inequalities


