Curated OER
Intersecting Graphs
Ninth graders know how to solve a system of linear equations, but what happens when the system involves an exponential function? The instructional slideshow teaches viewers to determine solutions to systems of equations with linear and...
Charleston School District
Pre-Test Unit 3: Functions
How does an input affect an output? Assess your learners' ability to answer this question using this pre-test. Scholars answer questions about the basics of a function. Topics include determining if a table or statement represents a...
EngageNY
Graphs of Simple Nonlinear Functions
Time to move on to nonlinear functions. Scholars create input/output tables and use these to graph simple nonlinear functions. They calculate rates of change to distinguish between linear and nonlinear functions.
West Contra Costa Unified School District
Using Derivatives to Graph Polynomials
You can learn to graph as well as a calculator using calculus. The lesson introduces using derivatives to find critical points needed to graph polynomials. Pupils learn to find local maximums and minimums and intervals of increase and...
Curated OER
Interpreting Graphs
Sixth graders interpret linear and nonlinear graphs. They create graphs based on a problem set. Next, they represent quantitive relationships on a graph and write a story related to graphing.
Curated OER
Exponential Functions
Analyze functions by their shape and equation and identify decay and growth based on the equation given. Learners graph their exponential functions and differentiate it using the logarithmic versus the exponential function.
Flipped Math
Calculus AB/BC - Sketching Graphs of Functions and Their Derivatives
Find deeper meaning in graphs. Pupils use the knowledge gained from the previous sections in the unit to sketch graphs of a function's derivative. Learners also see how to sketch a graph of a function given the graph of its derivatives....
Flipped Math
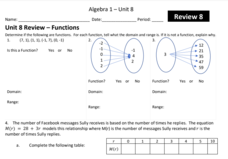
Unit 8 Review: Functions
Let's finish a functional review. Pupils work through 31 items to review the concepts learned in Unit 8. Scholars determine whether a mapping is a function and identify the domain and range. Using function notation, individuals then...
Annenberg Foundation
Skeeters Are Overrunning the World
Skeeters are used to model linear and exponential population growth in a wonderfully organized lesson plan including teachers' and students' notes, an assignment, graphs, tables, and equations. Filled with constant deep-reaching...
Curated OER
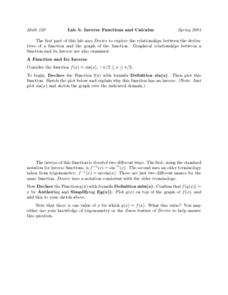
Lab 5: Inverse Functions and Calculus
Learners identify graphical relationships between a function and its inverse using a graphing calculator. They begin by declaring the function f(x) with formula definition sin(x), then plot this function. To finishing the lab, they check...
Curated OER
Three Methods for Using Quadratic Functions to Model Data
In this modeling data worksheet, students use quadratic functions to model data using three different methods. This worksheet provides explanations and an example. Additionally, students are given the steps to find the maximum or...
Inside Mathematics
Graphs (2006)
When told to describe a line, do your pupils list its color, length, and which side is high or low? Use a instructional activity that engages scholars to properly label line graphs. It then requests two applied reasoning answers.
Curated OER
Exploring Quadratic Data : Transformation Graphing
High schoolers analyze the vertex form of a parabola and find an approximate fit of a model. They explain the quadratic parabola function and its properties by developing quadratic models. They use translation and dilation to change the...
Kenan Fellows
Reading Airline Maintenance Graphs
Airline mechanics must be precise, or the consequences could be deadly. Their target ranges alter with changes in temperature and pressure. When preparing an airplane for flight, you must read a maintenance graph. The second lesson of...
Radford University
Fuel Efficient Function Activity
Pupils research the five most fuel efficient vehicles of the same type and come up with a way to display the mile per gallon for each vehicle. After choosing a vehicle, scholars create graphs to display miles traveled given the amount of...
5280 Math
Factory Functions
Solve a real-life problem using function-building skills. Presented with an open-ended question, scholars complete a checklist to create and justify a solution in an interesting algebra project. The checklist asks for justifications of...
EngageNY
Modeling a Context from Data (part 2)
Forgive me, I regress. Building upon previous modeling activities, the class examines models using the regression function on a graphing calculator. They use the modeling process to interpret the context and to make predictions based...
Virginia Department of Education
Transformational Graphing
Find relationships between the structure of a function and its graph. An engaging lesson explores seven parent functions and their graphs. Learners match functions to their graphs and describe transformations.
Virginia Department of Education
Rational Functions: Intercepts, Asymptotes, and Discontinuity
Discover different patterns by making connections between a rational function and its graph. An engaging instructional activity asks scholars to explore the behavior of different rational functions. Groups discover a connection between...
NASA
Weightless Wonder
A video of the weightless wonder provides a setting for the math to follow. Groups analyze the graph of a quadratic function that models the path of the C-9 as it gives astronauts the experience of weightlessness. Using a graphing...
Inside Mathematics
Squares and Circles
It's all about lines when going around. Pupils graph the relationship between the length of a side of a square and its perimeter. Class members explain the origin in context of the side length and perimeter. They compare the graph to the...
Virginia Department of Education
Functions 2
Demonstrate linear and quadratic functions through contextual modeling. Young mathematicians explore both types of functions by analyzing their key features. They then relate these key features to the contextual relationship the function...
Shodor Education Foundation
Graphit
No graphing calculator? No worries, there's an app for that! Young mathematicians use an app to graph functions. In addition, they can also plot data points.
Virginia Department of Education
Nonlinear Systems of Equations
Explore nonlinear systems through graphs and algebra. High schoolers begin by examining the different types of quadratic functions and their possible intersections. They then use algebraic methods to solve systems containing various...


