EngageNY
Nature of Solutions of a System of Linear Equations
If at first you cannot graph, substitute. The lesson introduces the substitution method as a way to solve linear systems if the point of intersection is hard to determine from a graph. The 28th installment of a 33-part series finishes...
West Contra Costa Unified School District
Solving Systems of Inequalities
Don't throw away those transparency sheets just yet! Young scholars first review inequalities on a number line, then learn about graphing inequalities in the coordinate plane. Finally, they use overhead transparencies to create systems...
Mathwire
Graph Each Ordered Pair - Five Worksheets
This resource is composed of five separate worksheets on ordered pairs. After plotting each ordered pair, learners label each point, connect the points to create a figure, identify the polygon type, find the perimeter and area of the...
Shodor Education Foundation
Vertical Line Test
Connect the points to create a function. Using points given by the applet, pupils try to connect them to create a line that would pass the vertical line test. The resource keeps track of the number of sets the learner is able to identify...
Willow Tree
Equations of a Line
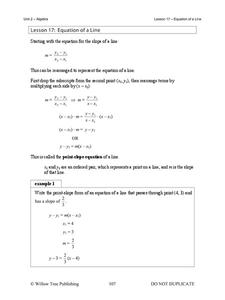
Each form of a linear equation has its purpose — pupils just have to find it. Building on the previous lesson in the series, learners examine point-slope and standard form. Using point-slope form, pupils write the equation of a...
EngageNY
Graphs of Exponential Functions and Logarithmic Functions
Graphing by hand does have its advantages. The 19th installment of a 35-part module prompts pupils to use skills from previous lessons to graph exponential and logarithmic functions. They reflect each function type over a diagonal line...
Virginia Department of Education
Graphing Linear Equations
Combine linear equations and a little creativity to produce a work of art. Math scholars create a design as they graph a list of linear equations. Their project results in a stained glass window pattern that they color.
Illustrative Mathematics
Walk-a-thon 1
Your mathematician's job is to explore the relationship between hours and miles walked during a walk-a-thon. The activity compels your learners to experiment with different means in finding out this proportional relationship. The answer...
Illustrative Mathematics
Sports Equipment Set
Many learners like to play sports and the equipment that goes with it costs money. The resource sets up an inequality that gives a total amount needed to purchase the equipment and the initial amount of money already obtained. In order...
EngageNY
Real-World Positive and Negative Numbers and Zero
Class members investigate how positive and negative numbers are useful in the real world. Individuals first read a short passage and identify terms indicating positive and negative numbers. They consider situations involving positive...
Curated OER
Solving Inequalities and Graphing
Students solve and graph inequalities on a number line. In this algebra lesson, students solve using addition, subtraction, multiplication and division and graph their solutions using open or closed circles. They graph with 80%-90%...
Curated OER
Graphing
In this graphing worksheet, students solve and graph 10 different problems that include determining various coordinates and the slope. First, they use the table to write the x and y coordinates for each point on the graphs. Then,...
Curated OER
Naming Points on the Coordinate Plane
In this naming points on the coordinate plane worksheet, students name 6 coordinates off of 6 graphs. Students name the x and y-coordinates of 6 different points in all four quadrants.
Curated OER
How Long Can You Go?
Eighth graders examine the usefulness of a line of best fit by collecting and graphing data, using a graphing calculator to determine the line of best fit, and making a variety of predictions. They watch a video, then design a...
Mr. E. Science
Motion
An informative presentation covers motion, metric system, conversions, graphing of coordinates and lines, speed, velocity, and acceleration problems, as well as mean calculations. This is the first lesson in a 26-part series.
West Contra Costa Unified School District
Correlation and Line of Best Fit
Computers are useful for more than just surfing the Internet. Pupils first investigate scatter plots and estimate correlation coefficients. Next, they use Microsoft Excel to create scatter plots and determine correlation coefficients and...
Noyce Foundation
Percent Cards
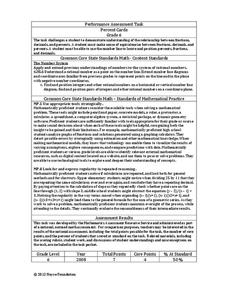
Explore different representations of numbers. Scholars convert between fractions, decimals, and percents, and then use these conversions to plot the values on a horizontal number line.
West Contra Costa Unified School District
Key Features of Graphs
The key is ... After a day of instruction on key features of graphs, groups create a poster and presentation on the key features of their given function graph. The resource provides an extension activity of "telephone" using graphs.
West Contra Costa Unified School District
Exploring Quadratics and Graphs
Young mathematicians first graph a series of quadratic equations, and then investigate how various parts of the equation change the graph of the function in a predictable way.
EngageNY
Finding One Hundred Percent Given Another Percent
Class members solve problems to find the whole when given a percent. They use double line numbers and factors of hundred to help break the 100 percent into equal segments.
Radford University
How to Calculate and Analyze the Equation for a Parabolic Path
Working in groups, pupils plot three points on the coordinate plane representing three different parabolic paths. Using a calculator, they determine the quadratic regression equation for their models. Each team then figures out the...
Curated OER
Algebra I - Worksheet G12: Graphing Lines
In this graphing lines worksheet, students graph 28 lines given various data. Students graph lines given two points, a point and slope, and a line perpendicular or parallel to a point.
Curated OER
Now, what the heck is a NUMBER LINE again???
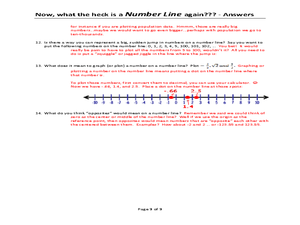
A unique approach to reviewing number lines and how to locate different values on them, this instructional activity poses several questions that require written answers rather than calculations. You could use this as a note-taking guide...
Curated OER
Worksheet 11 - Points of Discontinuity
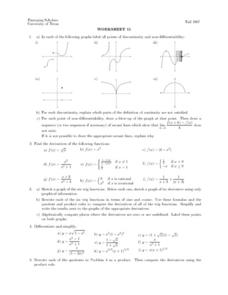
In this points of discontinuity worksheet, students observe graphs and label them as points of discontinuity and non-differentiability. They identify the derivatives of functions. This one-page worksheet contains five multi-step problems.


