Concord Consortium
People and Places
Graph growth in the US. Given population and area data for the United States for a period of 200 years, class members create graphs to interpret the growth over time. Graphs include population, area, population density, and population...
Curated OER
Bouncing Ball
Students collect height versus time data of a bouncing ball using the CBR 2™ data collection device. Using a quadratic equation they graph scatter plots, graph and interpret a quadratic function, apply the vertex form of a quadratic...
Curated OER
Explorations 5: Introduction to Limits
In this limit worksheet, students find the interval values of given functions. They identify constants, and plot graphs. This three-page worksheet contains approximately 20 problems.
Curated OER
Equal Differences Over Equal Intervals 2
Your algebra learners explore linear functions concretely using tables of values in a collaborative task. The idea that linear function values change by equal differences over equal intervals, is emphasized. The slope and y-intercept...
Illustrative Mathematics
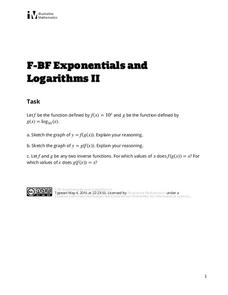
Exponentials and Logarithms II
A simple question sometimes is the best for discussion. High schoolers compare a logarithmic and exponential function and composite them into one another. They graph and compare the difference between the domains. The solution contains...
Howard County Schools
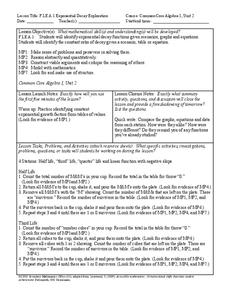
Exponential Decay Exploration
How can you model exponential decay? Explore different situations involving exponential decay functions and decreasing linear functions by performing activities with MandM candy, popcorn kernels, and number cubes.
Concord Consortium
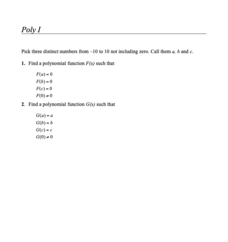
Poly I
Root for young mathematicians learning about functions. A set of two problems assesses understanding of polynomial functions and their roots. Scholars select values for a, b, and c, and then create two functions that meet given...
Concord Consortium
Poly II
Create polynomials with specific values. The task consists of writing three polynomial functions that evaluate to specific values for any given number. Scholars first find a polynomial that evaluates to one for a given value, then a...
EngageNY
The Graph of the Equation y = f(x)
Math language? Set notation is used in mathematics to communicate a process and that the same process can be represented as computer code. The concept to the loop in computer code models the approach pupils take when creating a solution...
Curated OER
Interpreting Graphs
Sixth graders interpret linear and nonlinear graphs. They create graphs based on a problem set. Next, they represent quantitive relationships on a graph and write a story related to graphing.
Curated OER
Mathematical Modeling
Study various types of mathematical models in this math lesson. Learners calculate the slope to determine the risk in a situation described. They respond to a number of questions and analyze their statistical data. Then, they determine...
Curated OER
Comparing Exponentials
Growing money exponentially is the context of this scenario that asks learners to compare investments in two certificate of deposit accounts. Your young investment analysts will learn about the exponential characteristics of money...
Curated OER
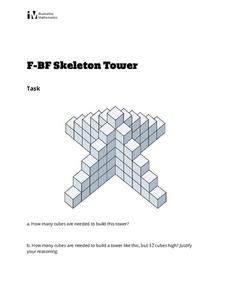
Skeleton Tower
Your algebra learners build a quadratic function in this task of counting the blocks used to build objects. The arithmetic sequence that shows up brings up a shortcut to the long addition using the Gauss Method. Eventually, learners...
PBL Pathways
Medical Insurance
Design a plan for finding the best health insurance for your money. Learners compare two health plans by writing and graphing piecewise functions representing the plan rules. Using Excel software, they create a technical report...
Big Learning
The Antarctica Project: A Middle School Mathematics Unit
Antarctica is a big place, large enough to provide ample opportunities to learn about math. A two-week unit teaches middle school mathematics concepts using project-based learning. The resource covers functions, geometry (area,...
Shodor Education Foundation
Data Flyer
Fit functions to data by using an interactive app. Individuals plot a scatter plot and then fit lines of best fit and regression curves to the data. The use of an app gives learners the opportunity to try out different functions to see...
Kenan Fellows
Man vs. Beast: Approximating Derivatives using Human and Animal Movement
What does dropping a ball look like as a graph? An engaging activity asks learners to record a video of dropping a ball and uploading the video to software for analysis. They compare the position of the ball to time and calculate the...
Mathematics Vision Project
Structures of Expressions
This comprehensive unit investigates transformations of quadratics, having learners follow "Optima" through the development and growth of her quilting business. Deftly weaving the story into the mathematical mechanics, the unit gives...
Balanced Assessment
Dot Patterns
Use geometric patterns to teach your class how to write functions. The assessment task has scholars consider a pattern of dots to draw the next picture of the pattern. Pupils then analyze the pattern, which helps them develop a function...
Curated OER
Calculus 10.2 day 2 - Vector Valued Functions
Looking for a lesson on vectors? Here is a PowerPoint that has six examples for finding velocity, acceleration, speed and direction of motion. One of the examples demonstrates the use of the TI-89 Graphing Calculator to solve a problem.
Illustrative Mathematics
Seven Circles III
A basic set-up leads to a surprisingly complex analysis in this variation on the question of surrounding a central circle with a ring of touching circles. Useful for putting trigonometric functions in a physical context, as well as...
Curated OER
Unstable Table
Bothered by a wobbly table? Learn how to fix this problem using concepts of slope and continuity. Pupils first consider the problem in two dimensions and then progress to three dimensions. The solution is really quite simple.
Willow Tree
Linear Relationships
There's just something special about lines in algebra. Introduce your classes to linear equations by analyzing the linear relationship. Young mathematicians use input/output pairs to determine the slope and the slope-intercept formula to...
Shodor Education Foundation
Graphit
No graphing calculator? No worries, there's an app for that! Young mathematicians use an app to graph functions. In addition, they can also plot data points.
Other popular searches
- Math Functions
- Math Functions Quadratic
- Math Functions Domain Range
- In/out Math Functions
- Math Functions and Patterns
- Math Functions Egg Carton
- Math Functions Spaghetti
- Math Functions Bridge
- Math Functions Rounding
- Composite of Math Functions
- Math Functions Quadractic
- Math Parent Functions


