Virginia Department of Education
Determining Direct Variation
Once learners realize what direct variation is, they see it's just a type of linear function. The activity poses a general question that leads to the creation of the y = kx formula. The resource includes discussion prompts and ideas for...
Pennsylvania Department of Education
What is the Chance?
Fourth and fifth graders make predictions using data. In this analyzing data instructional activity, pupils use experimental data, frequency tables, and line plots to look for patterns in the data in order to determine chance. You will...
Curated OER
Thinking Outside the Box
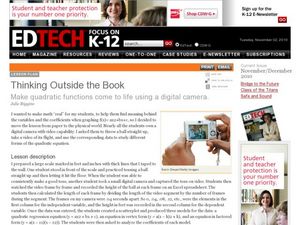
Now this lesson sounds fun! Young scholars throw a ball, film it as it soars through the air, and use a spreadsheet to collect data. A scatterplot is created to produce a quadratic regression equation, an equation in vertex form, and an...
West Contra Costa Unified School District
Introduction to Inverse Functions
Ready to share the beauty of the inverse function with your classes? This algebra II lesson guides the discovery of an inverse function through a numerical, graphical, and an algebraic approach. Connections are made between the three,...
National Council of Teachers of Mathematics
National Debt and Wars
Take a functional approach to the national debt. Learners collect information about the national debt by decade and plot the data. They determine whether an exponential curve is a good fit for the data by comparing the percent changes...
Virginia Department of Education
Changes in Ecosystems
How does water pollution affect the environment? Provide your class with the resources to answer this question as they learn about eutrophication and ecosystem changes. Over two weeks, they simulate the effects of pollution on the...
Virginia Department of Education
Square Patios
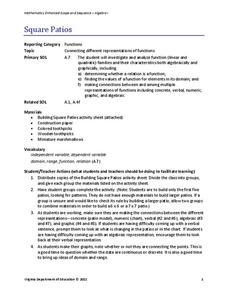
Build a patio from toothpicks and marshmallows to analyze functions! Learners look for patterns in the data as they create different size patios. As they discover patterns, they make connections between the different representations of...
02 x 02 Worksheets
Inverse Functions
Young mathematicians look for patterns in inverse functions as they relate to the original functions. The comprehensive lesson emphasizes vocabulary throughout as well as algebraic and graphical characteristics of the inverse functions.
Google
The Law of Large Numbers and Probability
Learners investigate why theoretical probability doesn't always match reality. The activity involves using Python 2.7 (or Sage) to set up a Bernoulli Trial. It also involves setting up a spreadsheet to simulate the Birthday Paradox....
Virginia Department of Education
The Rate of Motion
How much time does it take to jump over three balloons? Pupils calculate the speed of tasks that require different motions. They determine motions for tasks such as walking, skipping, hopping, and jumping before creating a...
Virginia Department of Education
Logarithmic Modeling
Explore logarithms and logarithmic regression. Young mathematicians first learn about inverse functions and about the logarithm function family. They take their newfound knowledge to use logarithmic functions to model situations and...
Virginia Department of Education
Linear Modeling
An inquiry-based algebra activity explores real-world applications of linear functions. Scholars investigate four different situations that can be modeled by linear functions, identifying the rate of change, as well as the...
Virginia Department of Education
Exponential Modeling
Investigate exponential growth and decay. A set of six activities has pupils collecting and researching data in a variety of situations involving exponential relationships. They model these situations with exponential functions and solve...
Illustrative Mathematics
Points on a Graph
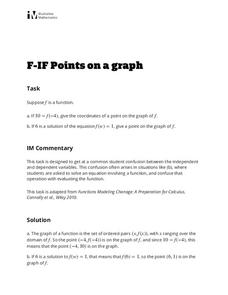
Learners practice using their knowledge of how to interpret a function and use function notation. The activity includes two questions. Given an input of a function and its output, the first question asks learners to write the ordered...
Curated OER
MP3 Purchase Plans
Use algebra to solve real world problems. Mathematicians practice use of graphs, tables, and linear functions to solve a problem regarding mp3 purchase plans. They work in groups to solve the problem and present their findings and...
Curated OER
How Alike Are We?
Fourth graders find the range, mode, median, and mean for each of the data sets (height and shoe size). They discuss which measure of central tendency for each data set best represents the class and why. Students graph the shoe size and...
Curated OER
Interpreting Data from Birdfeeders
What kinds of birds live in your area? Read a book about birds to your learners and explore their feeding patterns. Charts and graphs are provided in this three page packet, but consider assigning the basic questions if using with young...
Curated OER
Discovering Ohm's Law
Connect math with science! Pupils apply properties of Ohms Law as they solve problems and identify the inverse relationship of a function. They analyze the shape of the graph of an inverse function and use it to make predictions.
Curated OER
Biodiversity Debate - Stream Side Science
Role play community members who are both for and against the construction of a dam. Research the pros and cons and then hold a classroom debate. This activity ideally follows a series of stream studies, links to which are included. Use...
Curated OER
Graphs and Transformations of Functions
Is it possible to solve quadratic equations by factoring? It is, and your class will graph quadratic equation and functions too. They perform transformation on their graphs showing increasing and decreasing intervals, domain, and range....
Virginia Department of Education
Slippery Slope
Explore slope using geometric patterns. Young mathematicians investigate towers built from cubes to develop a linear pattern. They move the data to a coordinate plane to connect the pattern to slopes.
Virginia Department of Education
The Submarine
Submerge yourself in the study of slope. Scholars investigate a situation involving slope and the rate of change of a submarine. An additional example further explores the concept of slope by changing one of the conditions of the submarine.
Curated OER
Is there Treasure in Trash?
More people, more garbage! Young environmentalists graph population growth against the amount of garbage generated per year and find a linear model that best fits the data. This is an older resource that could benefit from more recent...
Curated OER
Scientific Method Unit: Bacteria
Students discover how to apply the steps of the inquiry process through the study of bacteria. Working in groups of four, they cooperatively read an article about bacteria and complete a graphic organizer. Group members share with others...


